BTS 2-Week Outlook
Bureau of Transportation Statistics Upcoming Releases May 29 through June 7 Upcoming from May 29 Wednesday, June 5, 2019 - 11:30am ET Airline Fuel Cost and Consumption, April 2019
Thursday, June 6, 2019 - 11:00am ET Airline Full-Time/Part-Time Employment, April 2019
Date TBD Airline On-Time/Tarmac/Mishandled Baggage/Denied Boardings Data, March 2019
Previously Released May 15 – U.S. Passenger Airline Employment, March 2019 May 16 – Airline Traffic Data, April 2019 Estimated, February 2019 Reported May 29 – North American Freight Data, March 2019
The Bureau of Transportation Statistics will release the following data sets in the next two weeks:
Wednesday, June 5, 2019 - 11:00am ET U.S. airlines March fuel cost was $2.02 per gallon, up 4 cents from February ($1.98) and up 6 cents from March 2018 ($2.06). Industry summary of airline fuel consumption, total fuel cost and price paid per gallon are available on the database. Individual airline numbers will be available on the BTS website.
Thursday, June 6, 2019 - 11:00am ET U.S. airlines March employment (733,824 total full-time and part-time)) was up 0.3% from February and up 3.7% from March 2018 (passenger+cargo). Monthly full-time and part-time employment statistics are reported by U.S. airlines that operate at least one aircraft that has more than 60 seats or the capacity to carry a payload of passengers, cargo and fuel weighing more than 18,000 pounds.
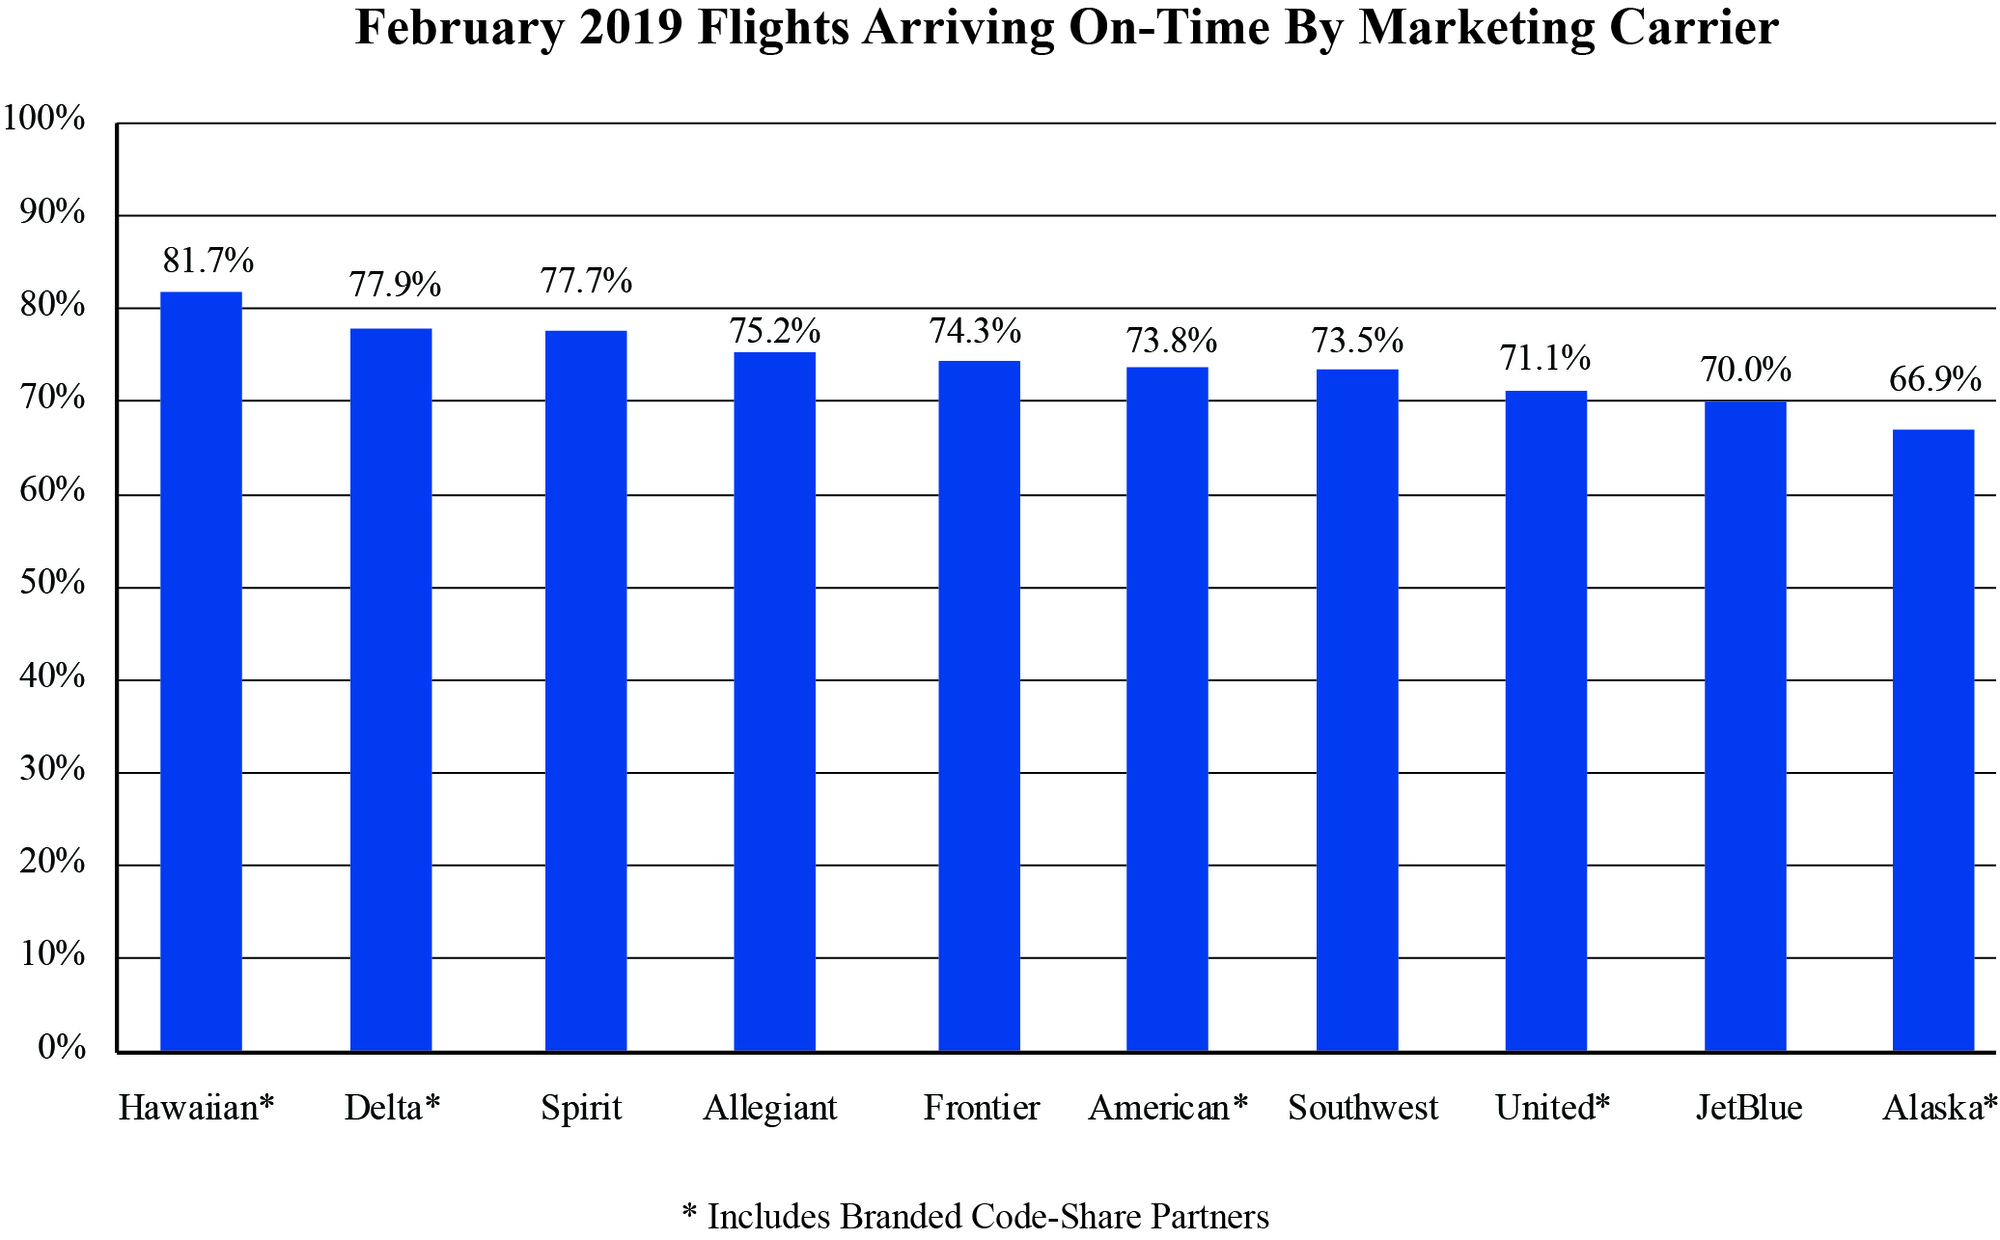
Date TBD This release consists on U.S. airline domestic monthly on-time performance, cancellations, tarmac data, mishandled baggage and denied boardings released in coordination with the Department of Transportation's release of the May Air Travel Consumer Report. From the previous month's release, in February 2019 reporting marketing carriers posted an on-time arrival rate of 73.8%, down from both the 78.4% on-time rate in January 2019 and from 78.9% in February 2018. The marketing carriers include branded code-share partners of mainline carriers.
BTS Previously
BTS has released the following:
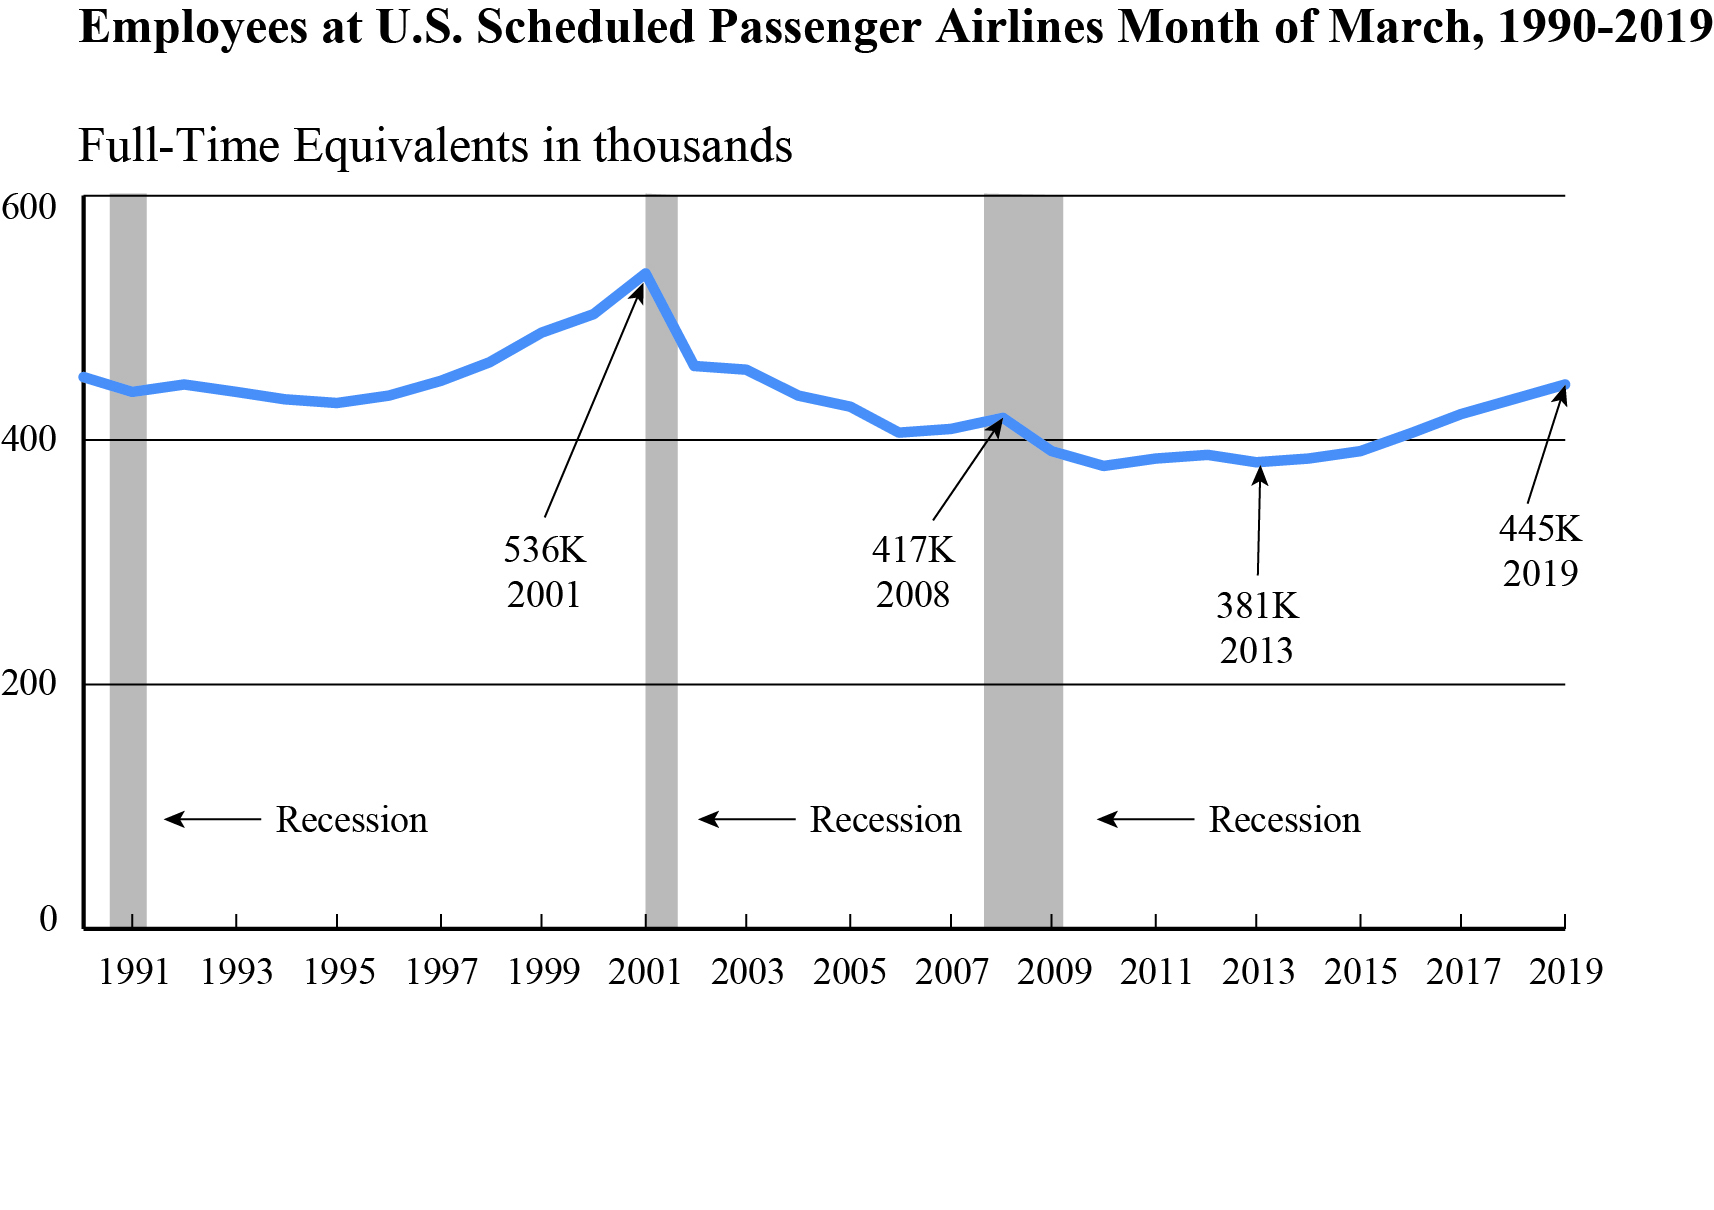
May 15 BTS reported that U.S. scheduled passenger airlines employed 2.5% more workers in March 2019 than in March 2018:
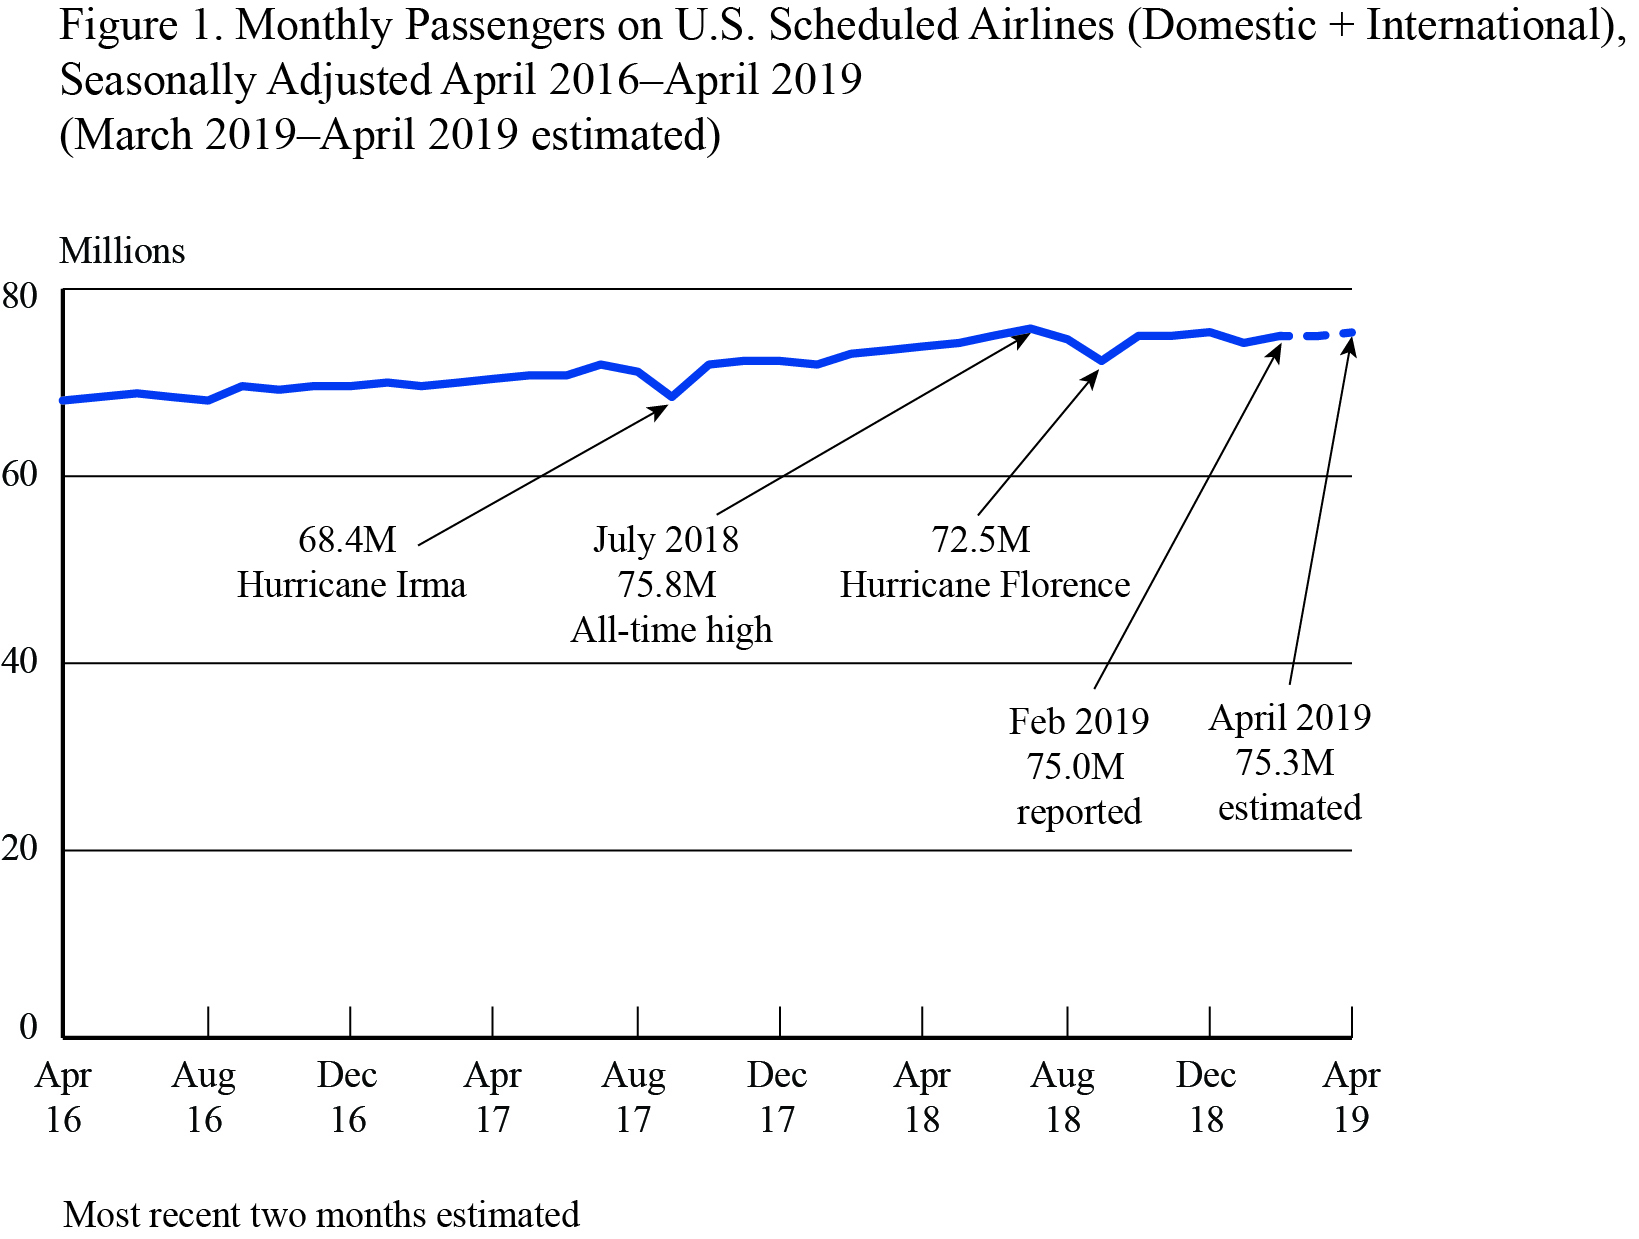
May 16 U.S. airlines carried an estimated 75.3 million systemwide (domestic and international) scheduled service passengers in April 2019, seasonally-adjusted, according to the Bureau of Transportation Statistics' (BTS) first estimate, up 0.3% from the March second estimate. The BTS estimate of the April enplanement total of 75.3 million was down 0.6% from the all-time, seasonally-adjusted, reported high of 75.8 million reached in July 2018. BTS estimated 65.8 million domestic passengers and 9.5 million international passengers on U.S. airlines flights in April. The air traffic estimate released is a statistical estimate based on U.S. airlines reported data through February.
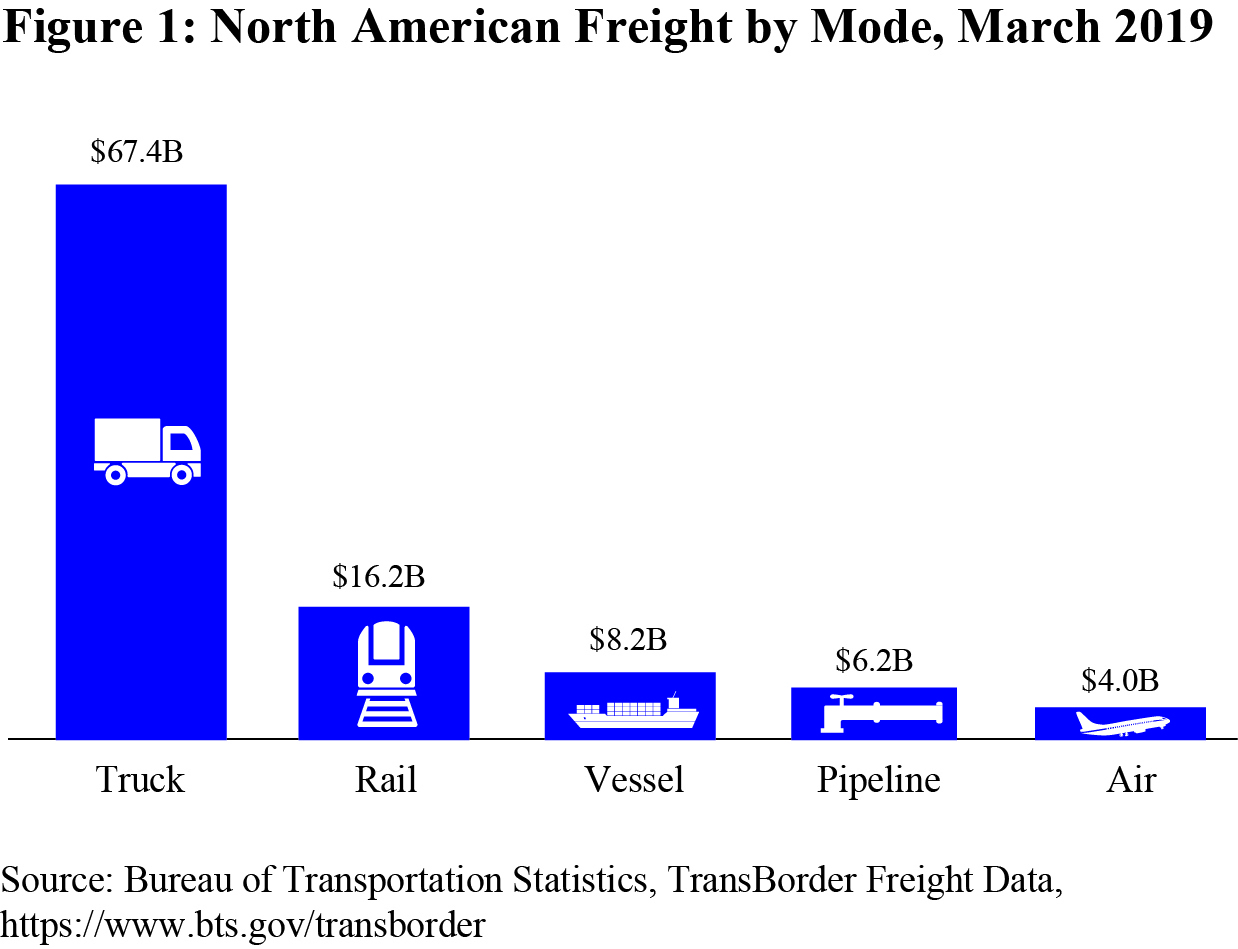
May 29 BTS reported that truck was the most used mode for shipping freight between the U.S. and other North American countries (Canada and Mexico) in March 2019:
BTS Contact: Dave Smallen 202-366-5568
| ||||||||||||||||||
Bureau of Transportation Statistics Upcoming Releases


Subscribe to:
Post Comments (Atom)
No comments:
Post a Comment