BTS 2-Week Outlook Bureau of Transportation Statistics Upcoming Releases November 25 thru December 6 Upcoming from November 25 Wednesday, December 4, 2019 - 11:00am ET Airline Fuel Cost and Consumption, October 2019
Thursday, December 5, 2019 - 11:00am ET Airline Full-Time/Part-Time Employment, October 2019
Previously Released Nov 14 - Transportation Services Index, September 2019 Nov 14 - Airline On-Time/Tarmac Times, September 2019 Nov 15 - Airline Traffic Data, October 2019 Estimated, August 2019 Reported Nov 18 - Passenger Airline Employment, September 2019 Nov 19 - North American Freight Data, September 2019
The Bureau of Transportation Statistics will release the following data sets in the next two weeks:
Wednesday, December 4, 2019 - 11:00am ET Previous release: U.S. airlines September fuel cost was $1.96/gal, up 2 cents from July 2019 ($1.94) and down 28 cents from September 2018 ($2.24). Industry summary of airline fuel consumption, total fuel cost and price paid per gallon are available on the database. Individual airline numbers through March are available on the BTS website.
Thursday, December 5, 2019 - 11:00am ET Previous release: U.S. airlines September employment (743,797 total full-time and part-time) was up 0.2% from August 2019 and up 2.9% from September 2018 (passenger+cargo). Monthly full-time and part-time employment statistics are reported by U.S. airlines that operate at least one aircraft that has more than 60 seats or the capacity to carry a payload of passengers, cargo and fuel weighing more than 18,000 pounds.
BTS Previously
BTS has released the following:
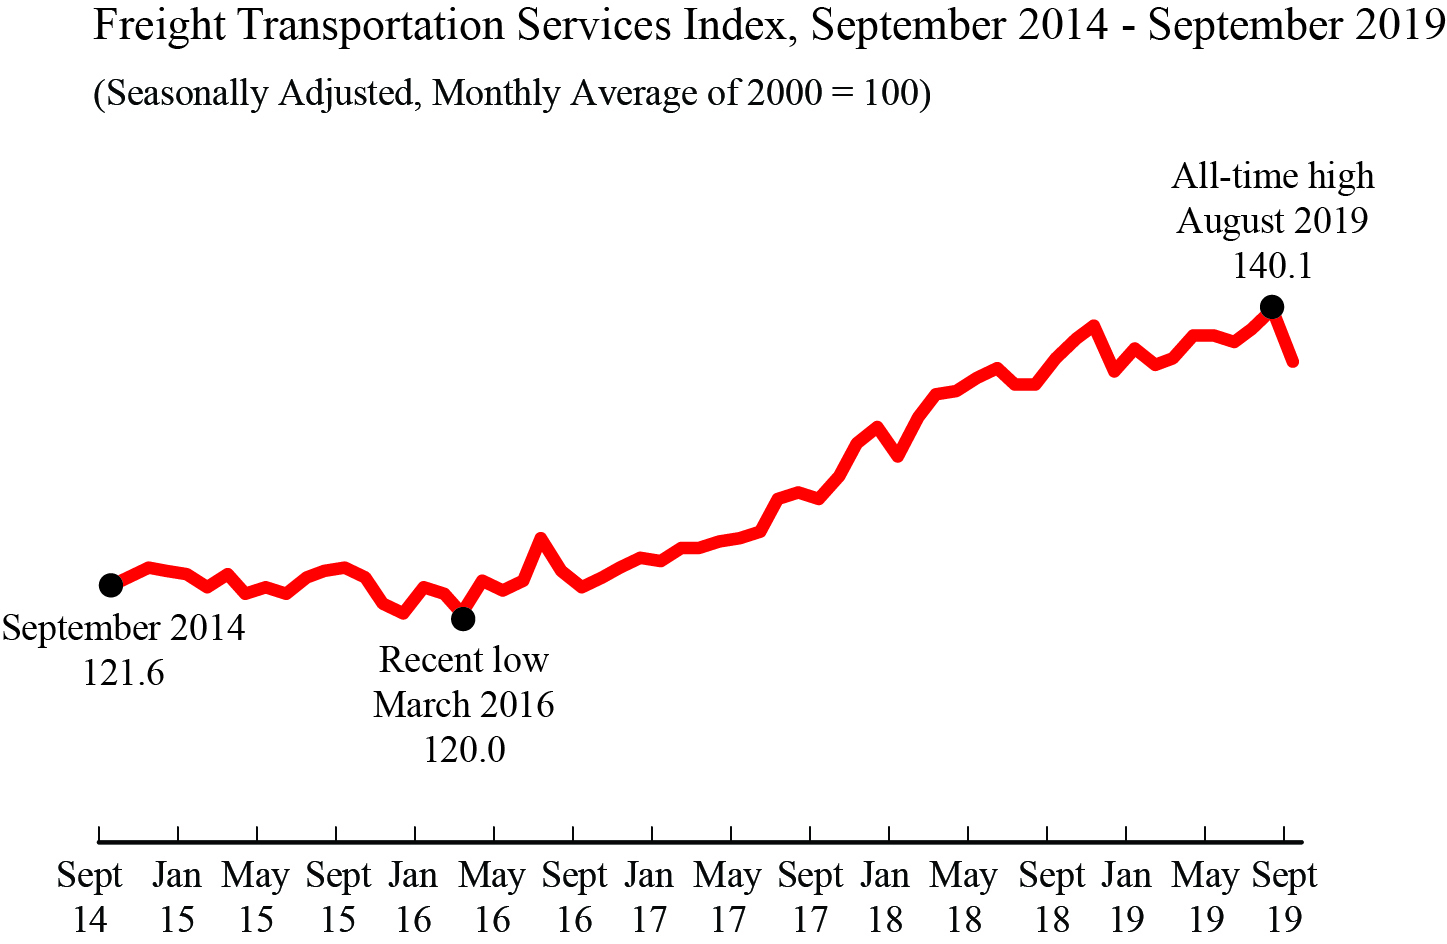
November 14 The Freight Transportation Services Index (TSI), which is based on the amount of freight carried by the for-hire transportation industry, fell 2.5% in September after reaching a new all-time high in August. From September 2018 to September 2019, the index fell 0.1% compared to a rise of 7.2% from September 2017 to September 2018.
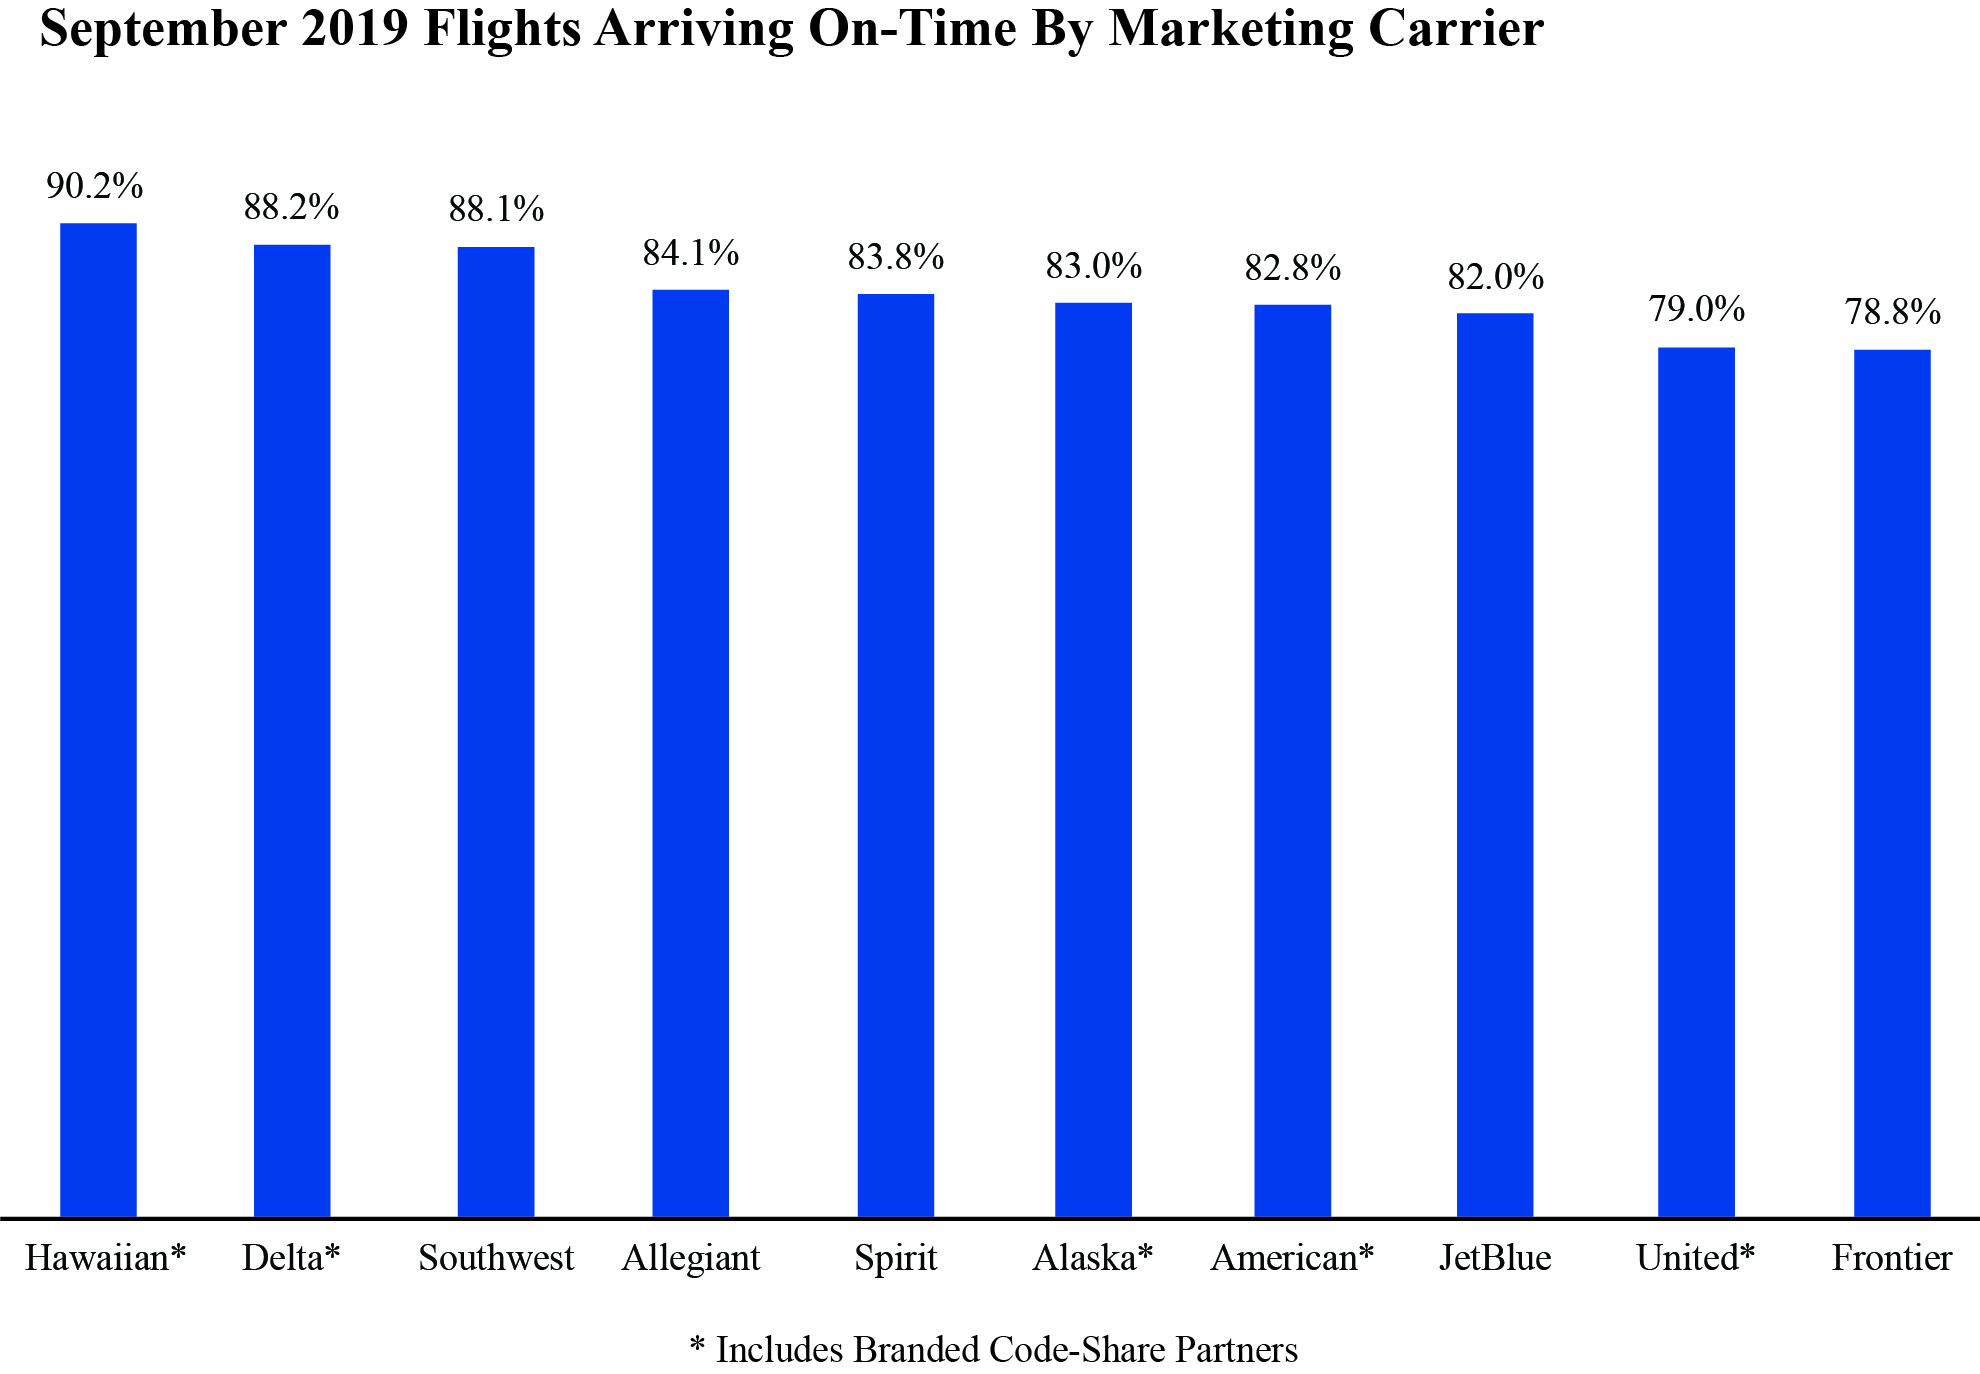
Nov. 14 In September 2019, reporting marketing carriers posted an on-time arrival rate of 84.1%, up from both the 77.6% on-time rate in August 2019 and from 81.9% in September 2018. The reporting marketing carriers canceled 1.7% of their scheduled domestic flights, lower than the rate of 1.8% in August 2019, but higher than the rate of 1.5% in September 2018.
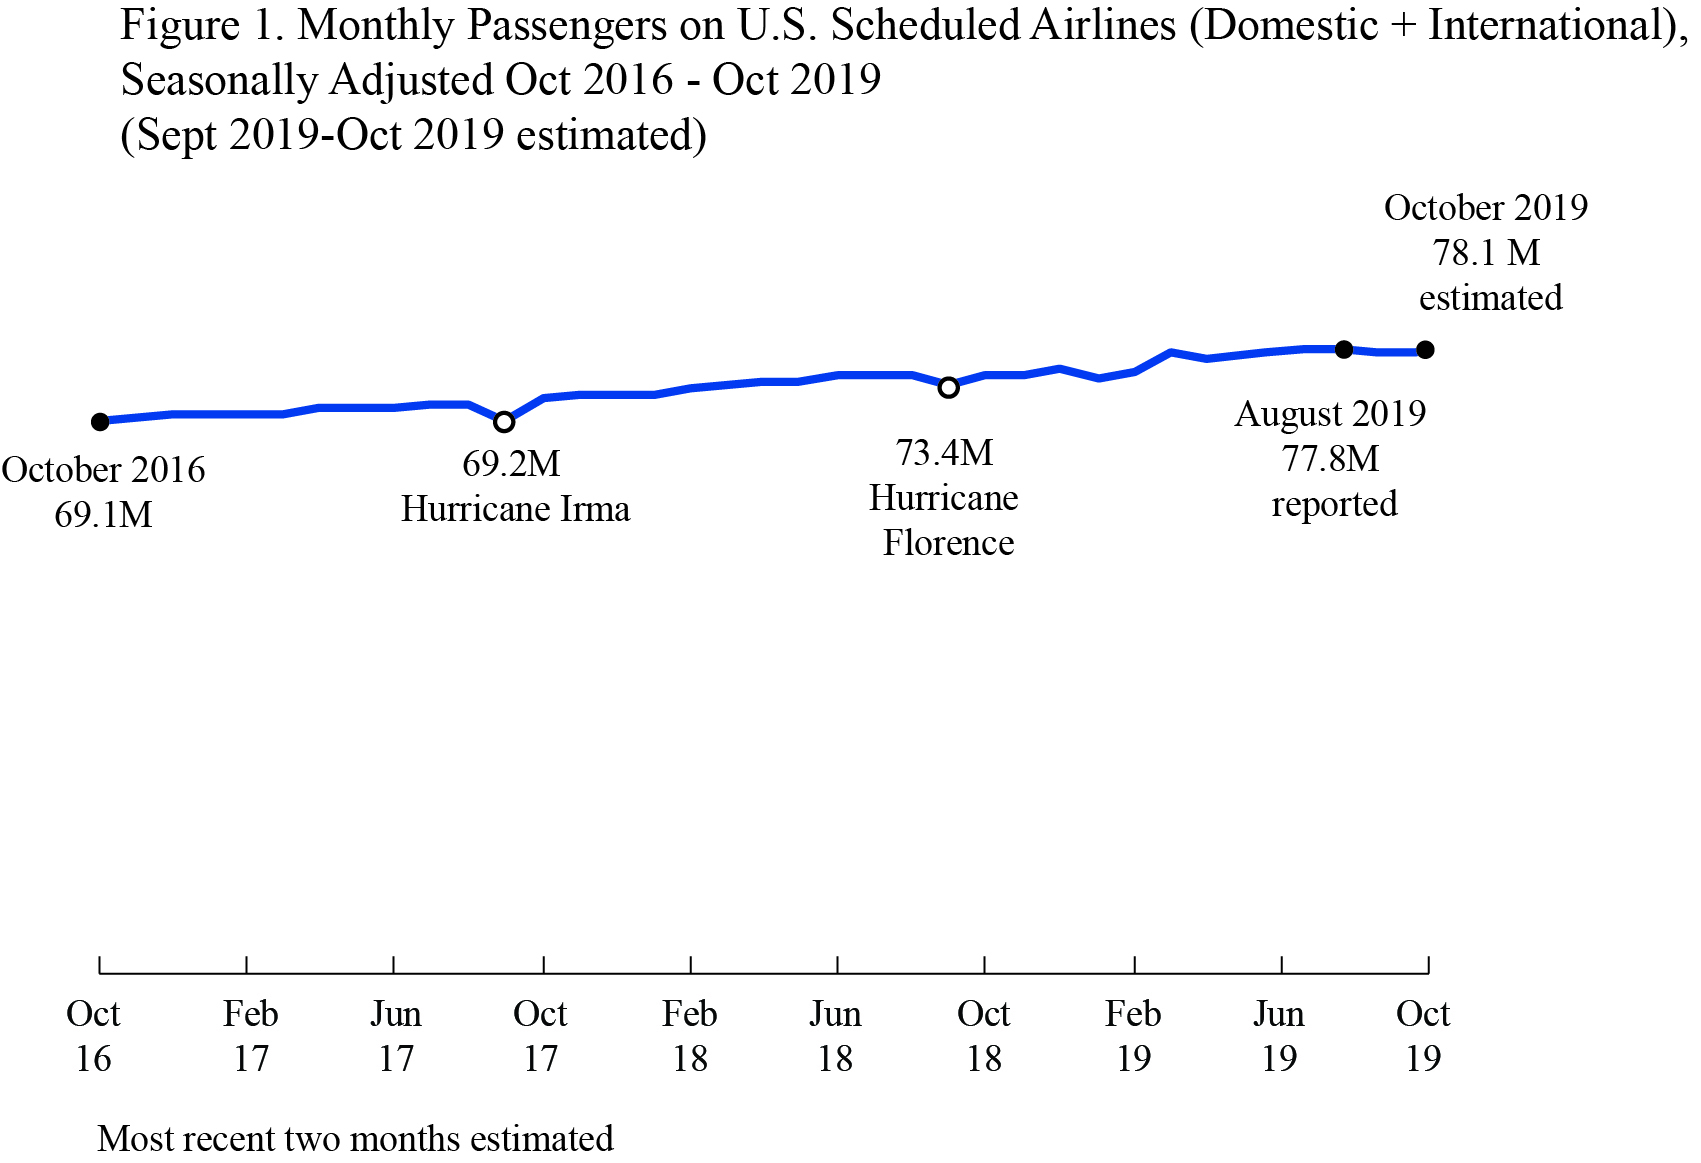
November 15 U.S. airlines carried an all-time high estimated 78.1 million system-wide (domestic and international) scheduled service passengers in October 2019, seasonally-adjusted, reaching a new seasonally-adjusted all-time high, according to the Bureau of Transportation Statistics' (BTS) first estimate, up 0.9% from the September second estimate. The air traffic estimate released is a statistical estimate based on U.S. airlines reported data through August. For the first 10 months of 2019, January through October, U.S. airlines carried 775.2 million passengers, the highest total based on comparable records since 2003.
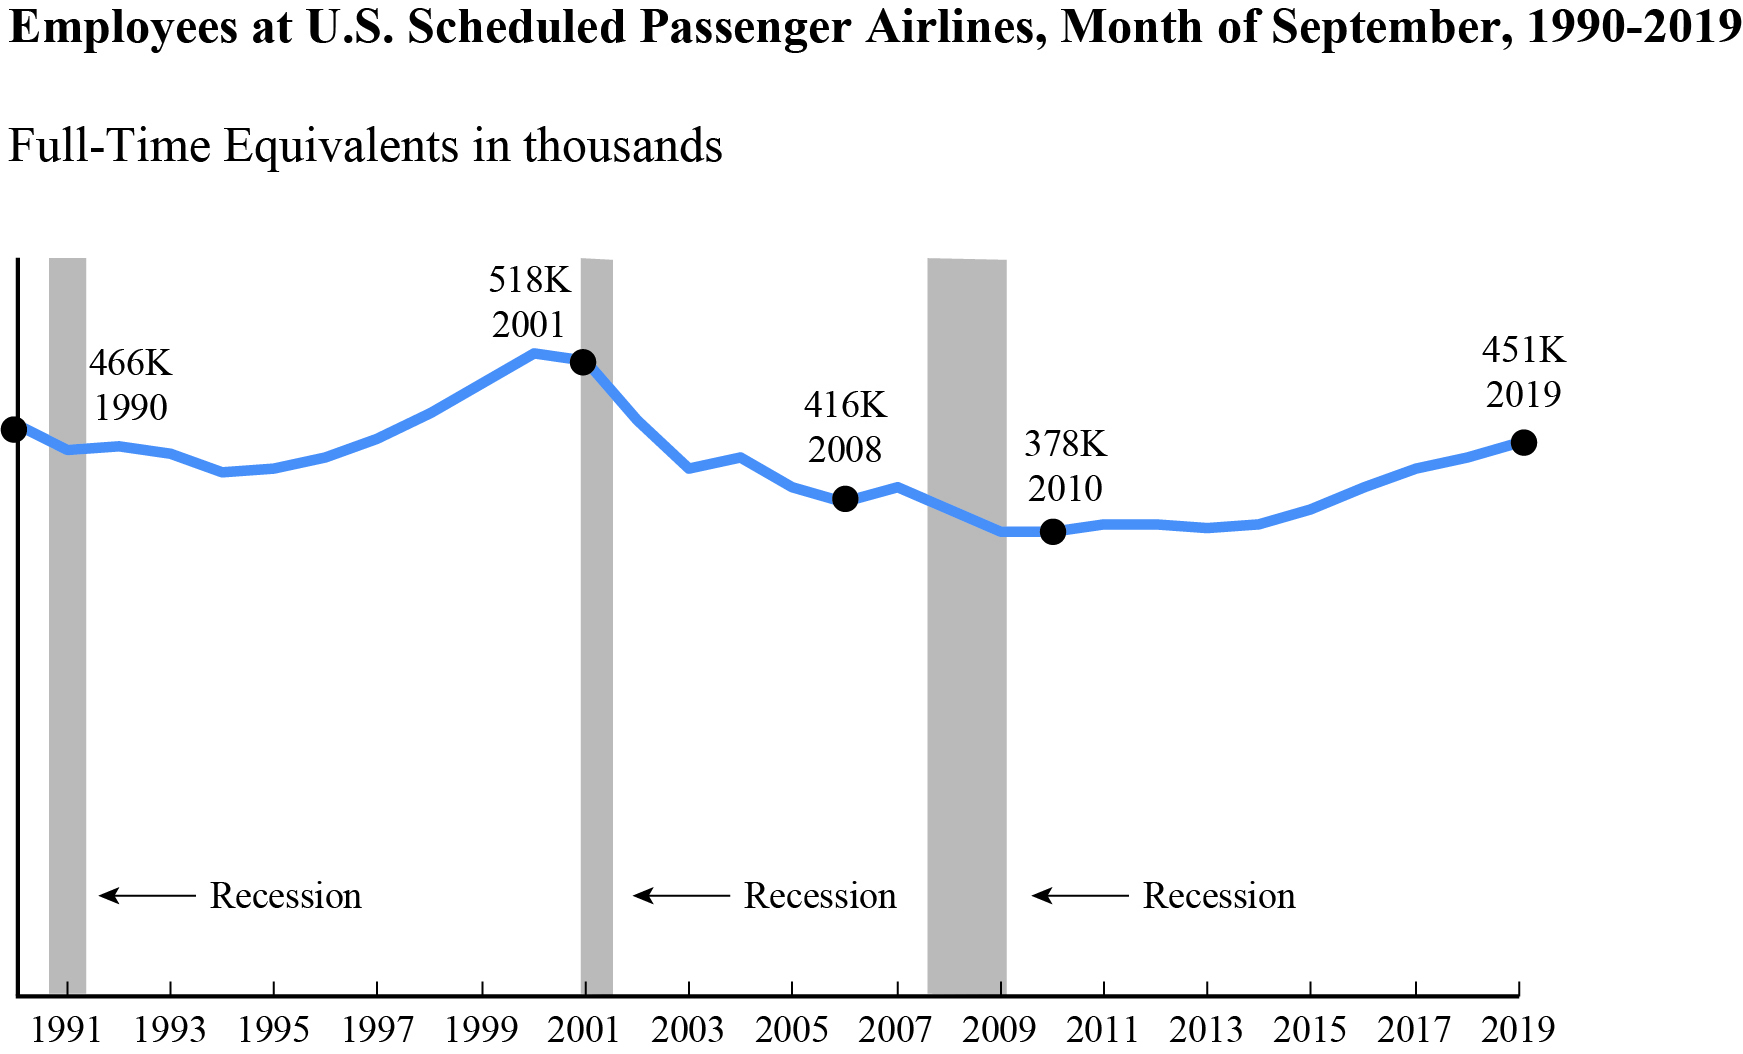
Nov 18 BTS reported that U.S. scheduled passenger airlines employed 2.3% more workers in September 2019 than in September 2018.
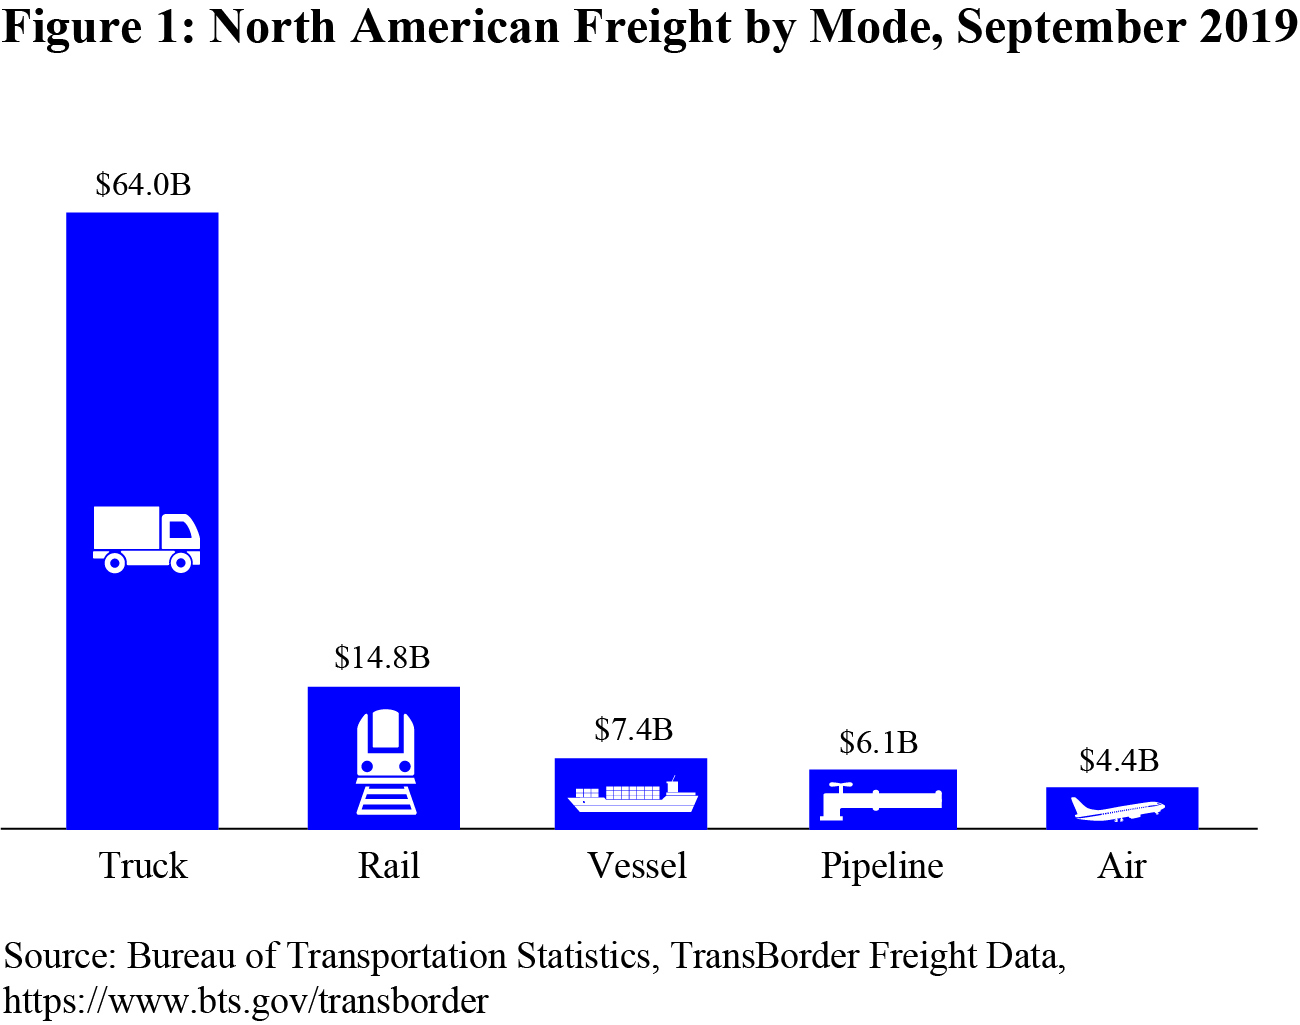
Nov 19 BTS reported that truck was the most used mode for shipping freight between the U.S. and other North American countries (Canada and Mexico) in September 2019:
BTS Contact: Dave Smallen 202-366-5568
| ||||||||||||||||||
Bureau of Transportation Statistics Upcoming Releases






Subscribe to:
Post Comments (Atom)
No comments:
Post a Comment