BTS 40-19 Tuesday, September 17, 2019 Contact: Dave Smallen Tel: 202-366-5568 July 2019 U.S. Passenger Airline Employment Data
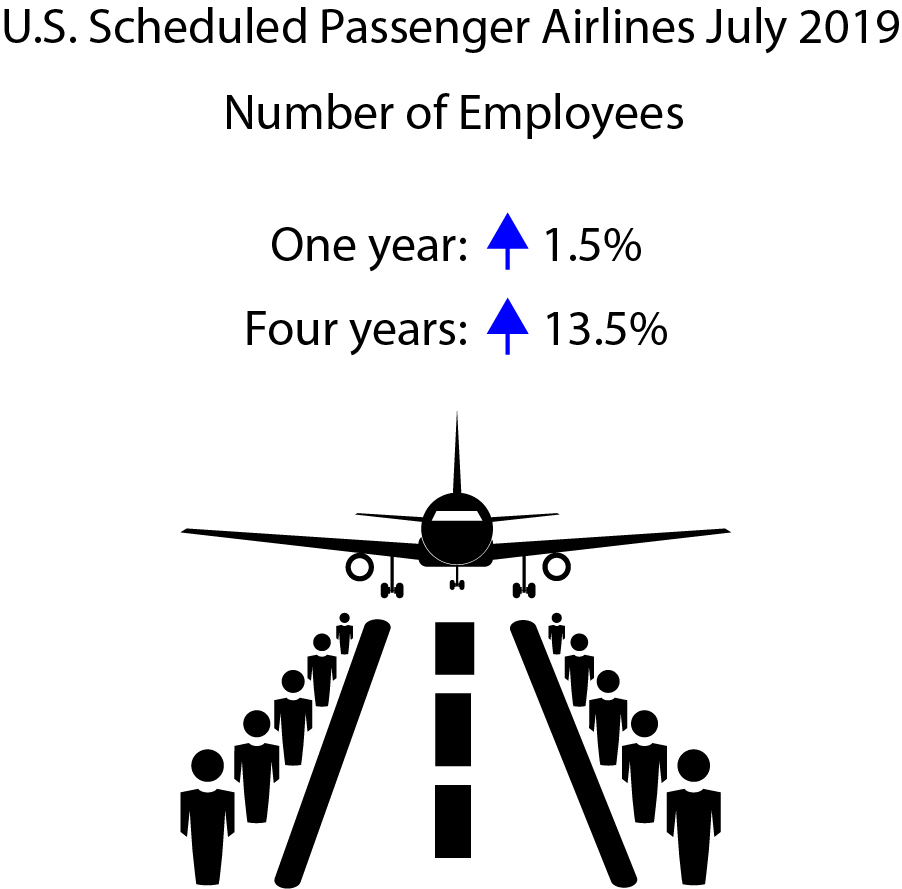
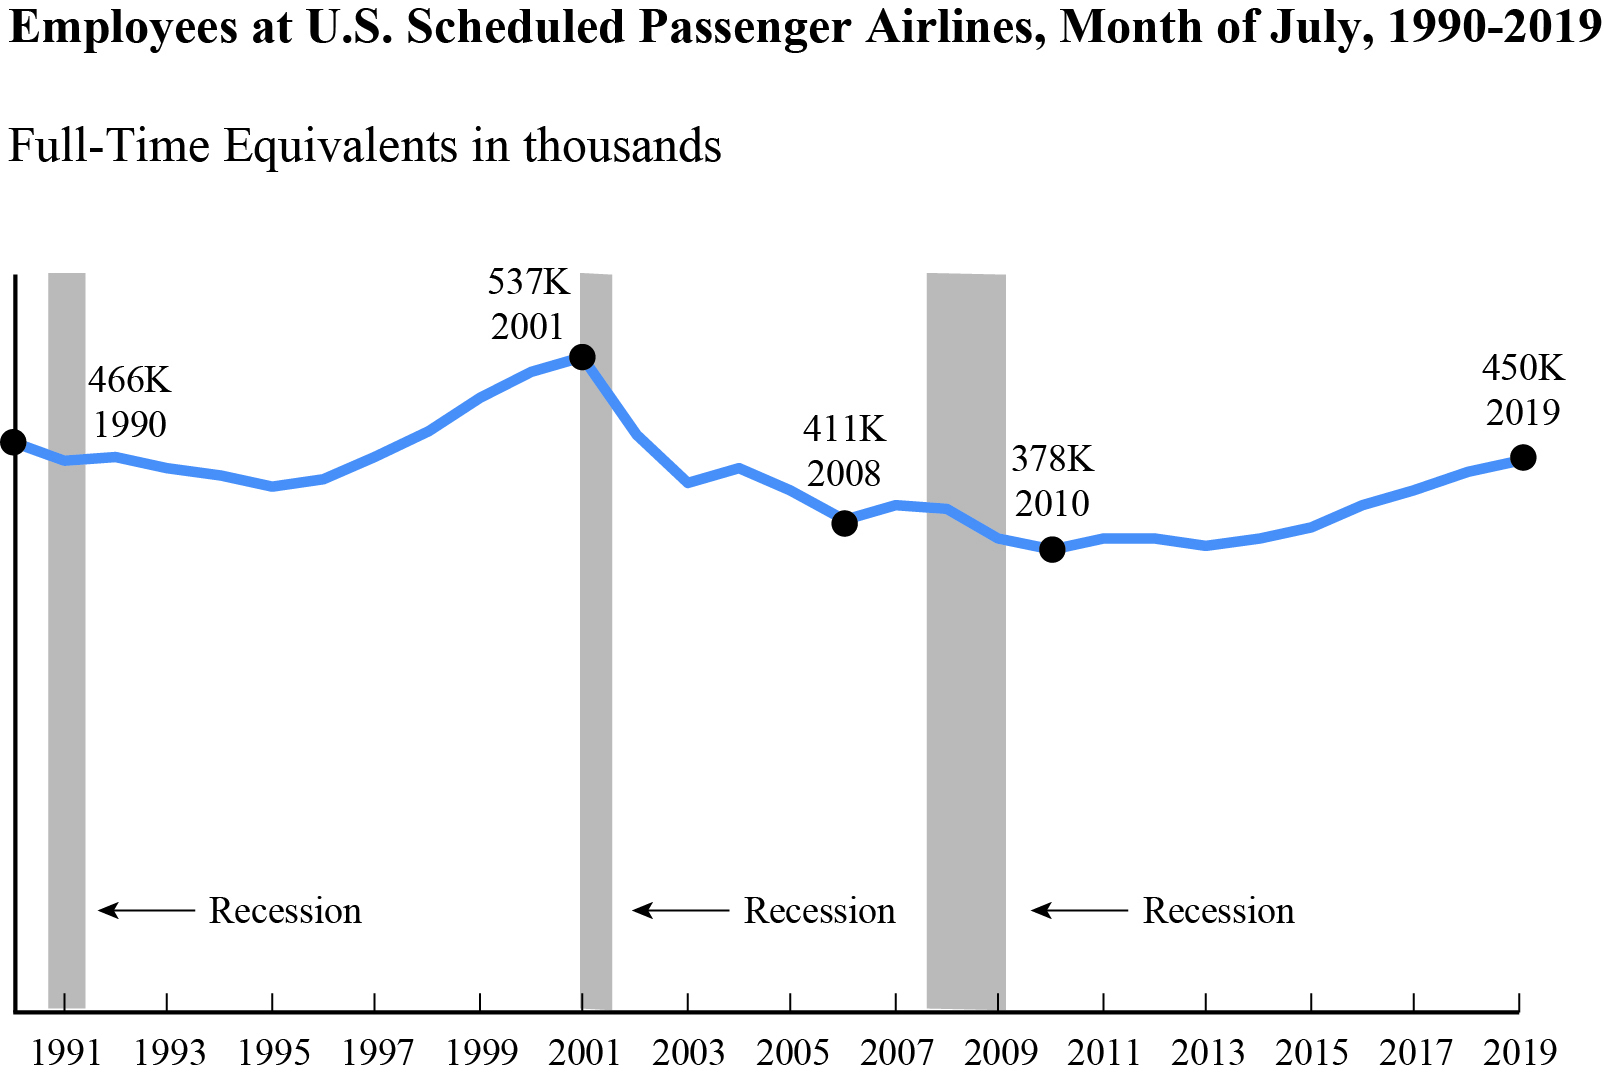
The 21 U.S. scheduled passenger airlines employed 1.5% more workers in July 2019 than in July 2018:
U.S. airline employment reports are filed monthly with the Bureau of Transportation Statistics. See the tables that accompany this release on the BTS website for detailed data since 2015 (Tables 1-15) and industry summary data since 1990.
All 21 scheduled service passenger airlines
Four network airlines
Network airlines operate a significant portion of their flights using at least one hub where connections are made for flights to down-line destinations or spoke cities. Note that beginning with January 2018 data, Virgin America's numbers are included with Alaska Airlines in the network category.
Five low-cost airlines
Low-cost airlines operate under a low-cost business model, with infrastructure and aircraft operating costs below the overall industry average.
10 regional airlines
Regional carriers typically provide service from small cities, using primarily regional jets to support the network carriers' hub and spoke systems.
Top Employers by Group
Two other airlines Other carriers generally operate within specific niche markets. They are: Hawaiian Airlines and Sun Country Airlines.
Reporting Notes Airlines that operate at least one aircraft that has more than 60 seats or the capacity to carry a payload of passengers, cargo and fuel weighing more than 18,000 pounds must report monthly employment statistics.
Data are compiled from monthly reports filed with BTS by commercial air carriers as of Sept. 10. Additional airline employment data and previous releases can be found on the BTS website. BTS has scheduled release of August passenger airline employment data for Oct. 16.
| ||||||||||||||||||
July 2019 U.S. Passenger Airline Employment Data






Subscribe to:
Post Comments (Atom)
No comments:
Post a Comment