BTS 2-Week Outlook
Bureau of Transportation Statistics Upcoming Releases September 30 thru October 11 Upcoming from September 30 Thursday, October 3, 2019 - 11:00am ET Airline Fuel Cost and Consumption, August 2019
Monday, October 7, 2019 - 11:00am ET Airline Full-Time/Part-Time Employment, August 2019
Wednesday, October 9, 2019 - 10:00am ET Transportation Services Index, August 2019
Thursday, October 10, 2019 - 11:00am ET Airline Traffic Data, September 2019 Estimated, July 2019 Reported
TBD Airline On-Time/Tarmac Times, August 2019
Previously Released Sept. 16 - Airline Financial Data, 2nd Quarter 2019 Sept. 17 - Passenger Airline Employment, July 2019 Sept. 24 - North American Freight Data, July 2019 Sept. 25 – Bikeshare/E-scooter Interactive Map
The Bureau of Transportation Statistics will release the following data sets in the next two weeks:
Thursday, October 3, 2019 - 11:00am ET Previous release: U.S. airlines July fuel cost was $1.98/gal, down 3 cents from June 2019 ($2.01) and down 22 cents from July 2018 ($2.20). Industry summary of airline fuel consumption, total fuel cost and price paid per gallon are available on the database. Individual airline numbers through March are available on the BTS website.
Monday, October 7, 2019 - 11:00am ET Previous release: U.S. airlines July employment (743,917 total full-time and part-time) was virtually unchanged from June 2019 and up 3.0% from July 2018 (passenger+cargo). Monthly full-time and part-time employment statistics are reported by U.S. airlines that operate at least one aircraft that has more than 60 seats or the capacity to carry a payload of passengers, cargo and fuel weighing more than 18,000 pounds.
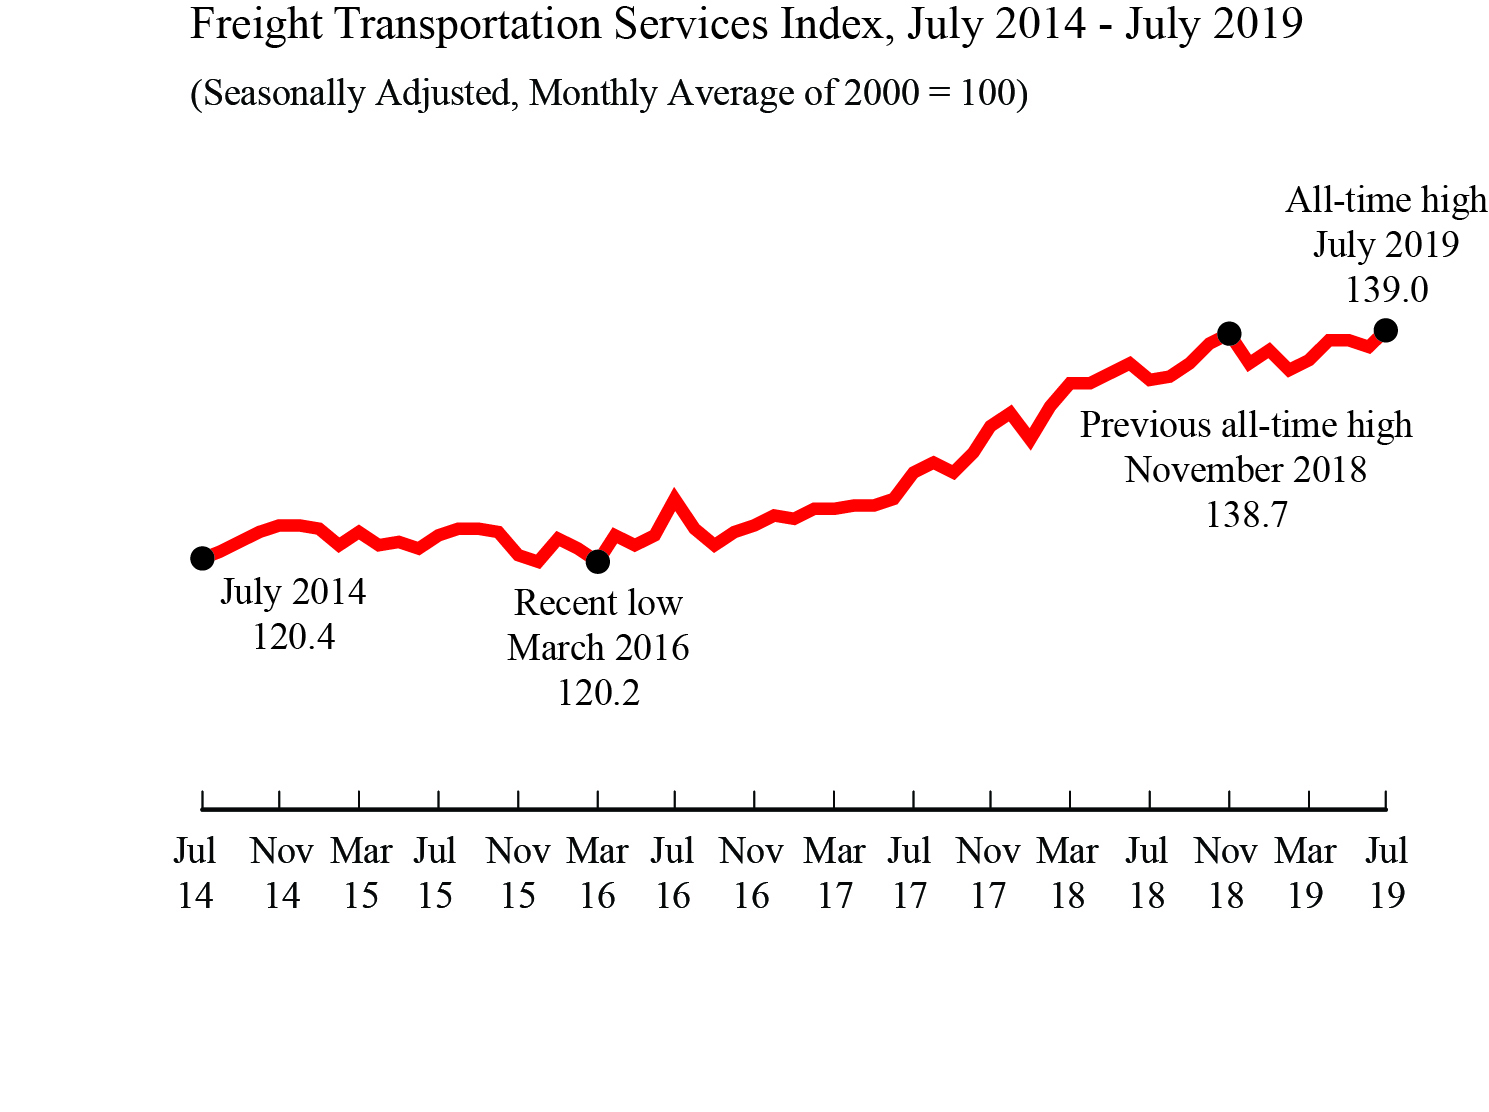
Wednesday, October 9, 2019 - 10:00am ET The Freight TSI measures the month-to-month changes in for-hire freight shipments by mode of transportation. The Passenger TSI measures the month-to-month changes in travel that involves the services of the for-hire passenger transportation sector. In the previous release for July, BTS reported that the Freight TSI was at its highest all-time level, up 0.9% from June, up 0.2% from the previous peak in November 2018. From July 2018 to July 2019, the index rose 2.9% compared to a rise of 6.0% from July 2017 to July 2018.
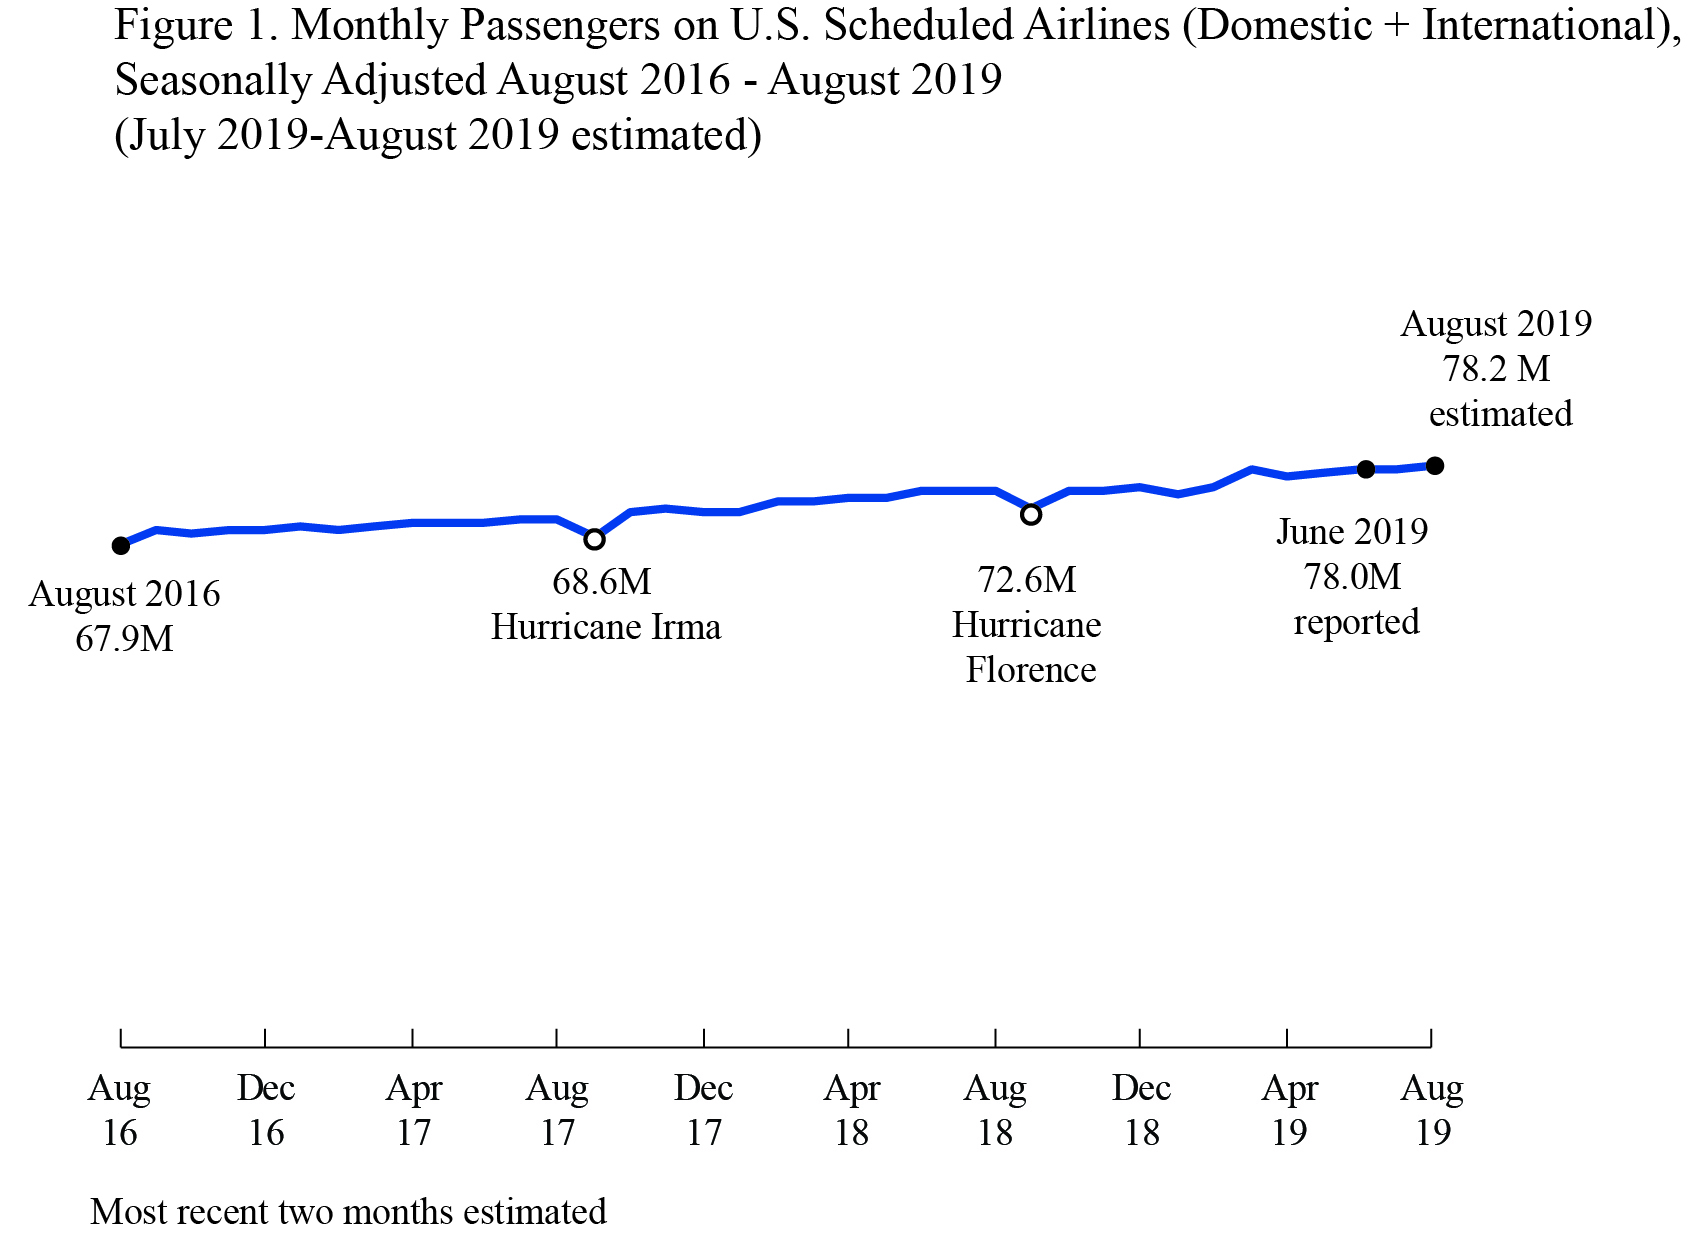
Thursday, October 10, 2019 - 11:00am ET BTS estimates of air traffic data for August and September based on reported data through July. Estimates are for U.S. airlines monthly passengers, revenue passenger-miles, available seat-miles and load factor for systemwide, domestic and international. Numbers are seasonally-adjusted and unadjusted. In the previous release with the first estimate for August, U.S. airlines carried an all-time high estimated 78.2 million systemwide (domestic and international) scheduled service passengers, seasonally-adjusted, more than in any other month and up 4.7% from August 2018. For the first eight months of 2019, January through August, U.S. airlines carried 623 million passengers, up 4.0% from the first eight months of 2018 and the highest total based on comparable records since 2003.
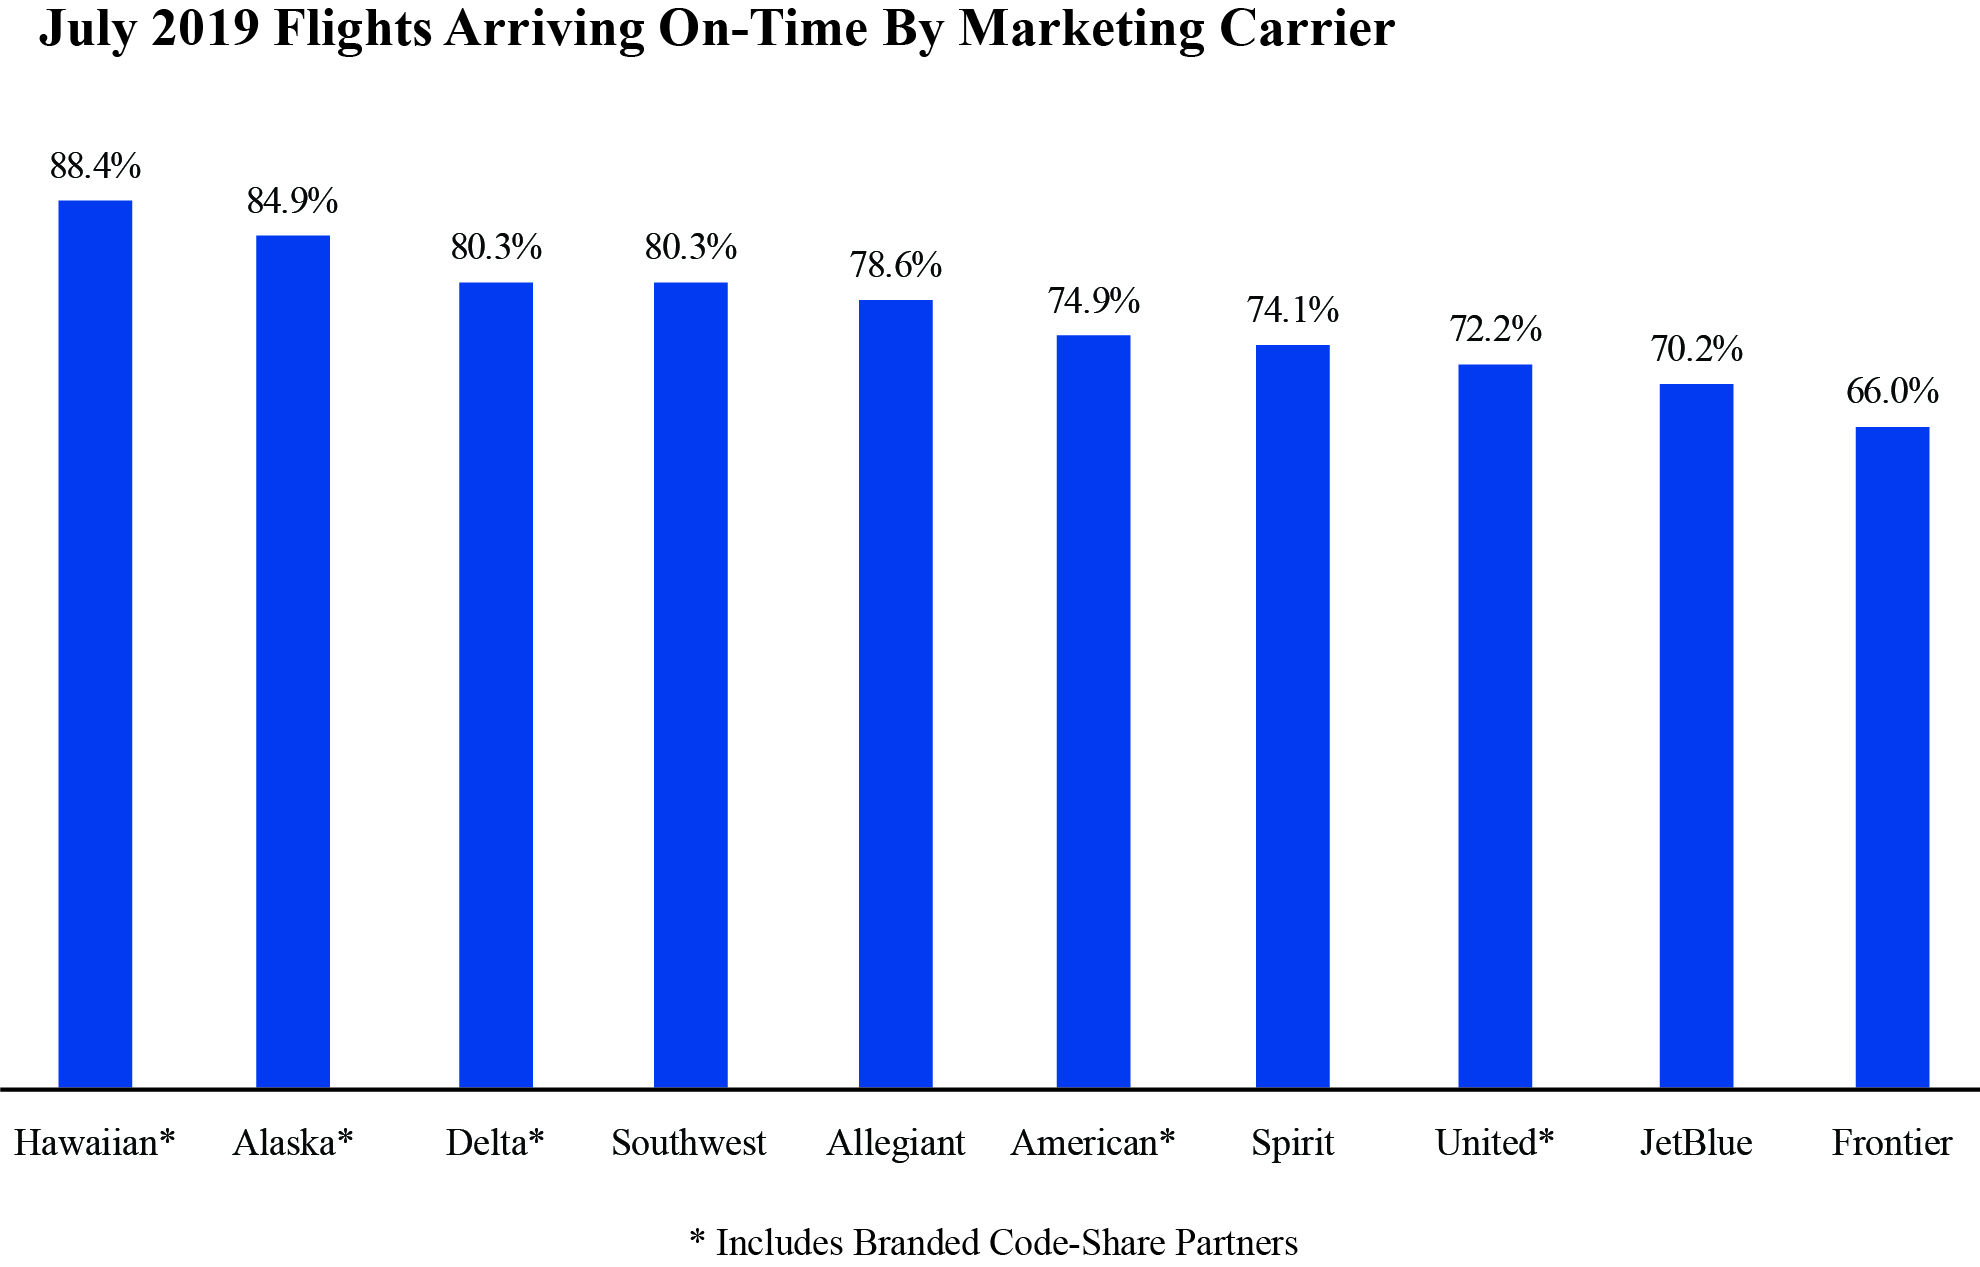
Date TBD This release consists on U.S. airline domestic monthly on-time performance, cancellations, tarmac data, mishandled baggage and denied boardings released in coordination with the Department of Transportation's release of the Air Travel Consumer Report. From the previous month's release, in July 2019 reporting marketing carriers posted an on-time arrival rate of 76.9%, up from both the 73.3% on-time rate in June 2019 and from 76.0% in July 2018. Reporting marketing carriers canceled 2.1% of their scheduled domestic flights, equal to the rate of 2.1% in June 2019 but a higher rate than 1.8% in July 2018. The marketing carriers include branded code-share partners of mainline carriers.
BTS Previously
BTS has released the following:
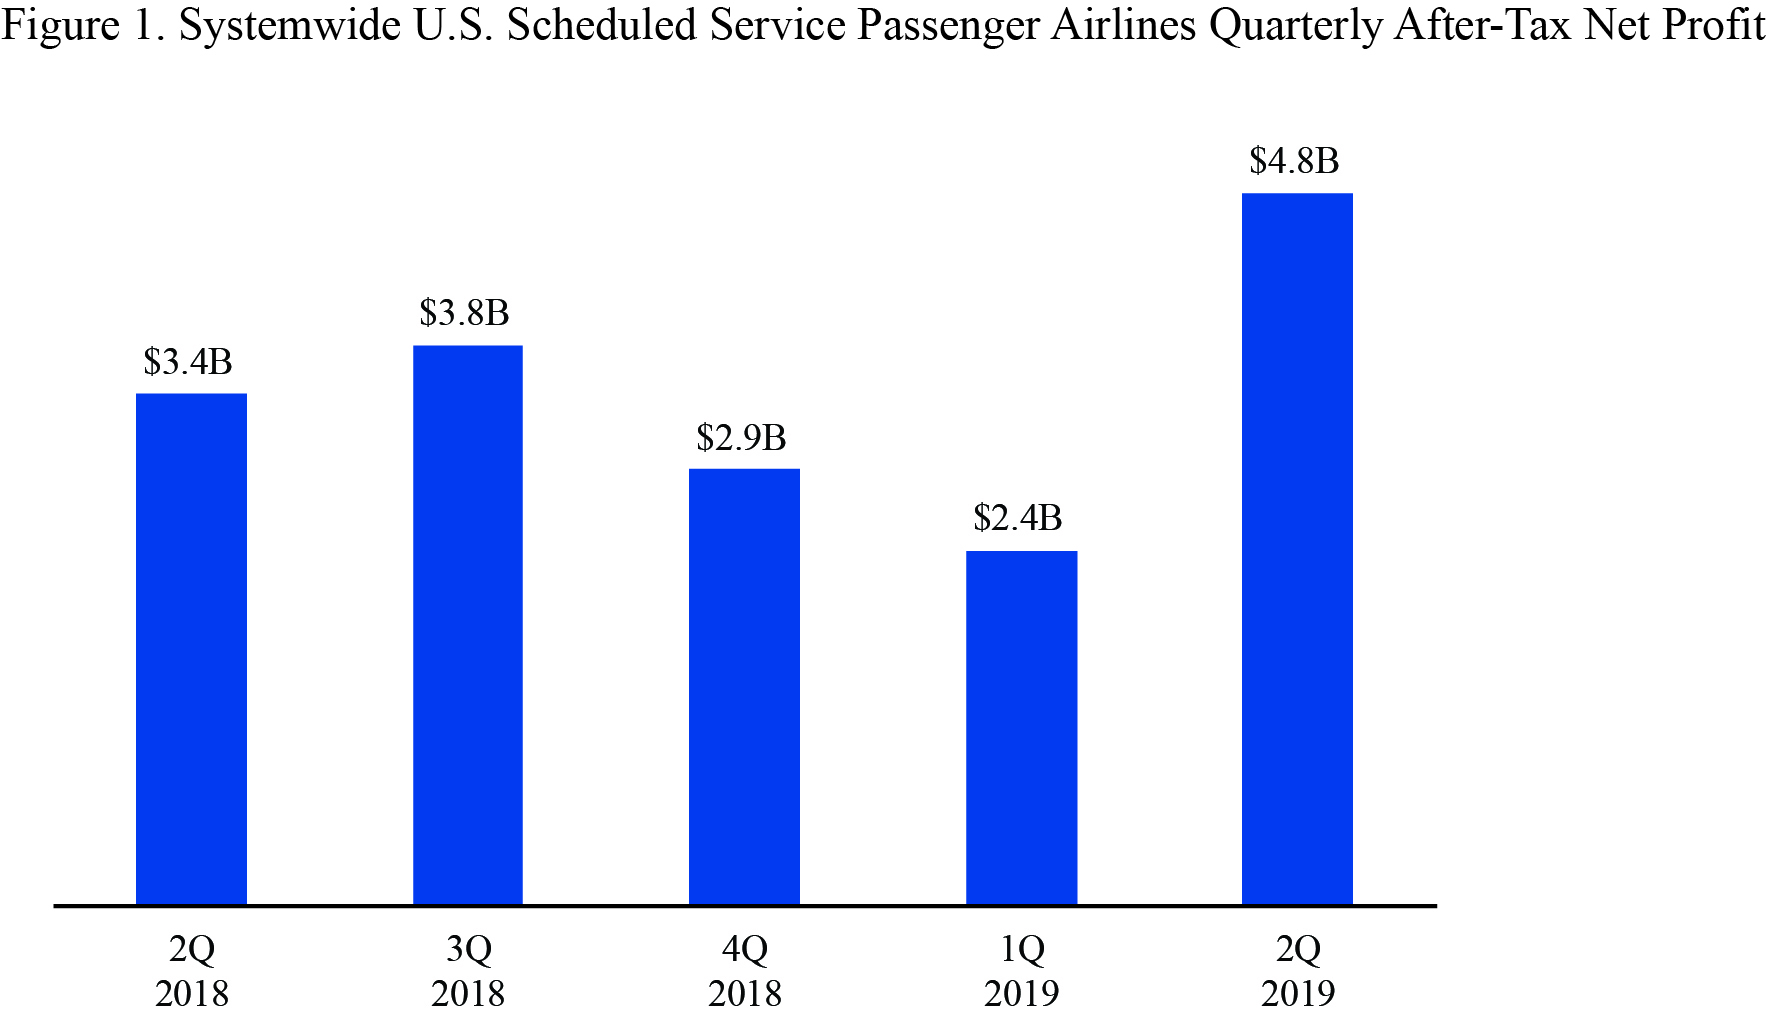
Sept 16 U.S. scheduled passenger airlines reported a second-quarter 2019 after-tax net profit of $4.8 billion, the 25th consecutive quarterly after-tax profit, and a pre-tax operating profit of $6.9 billion, the 33rd consecutive quarterly pre-tax profit. Additional financial numbers for all airlines are available on the BTS financial databases.
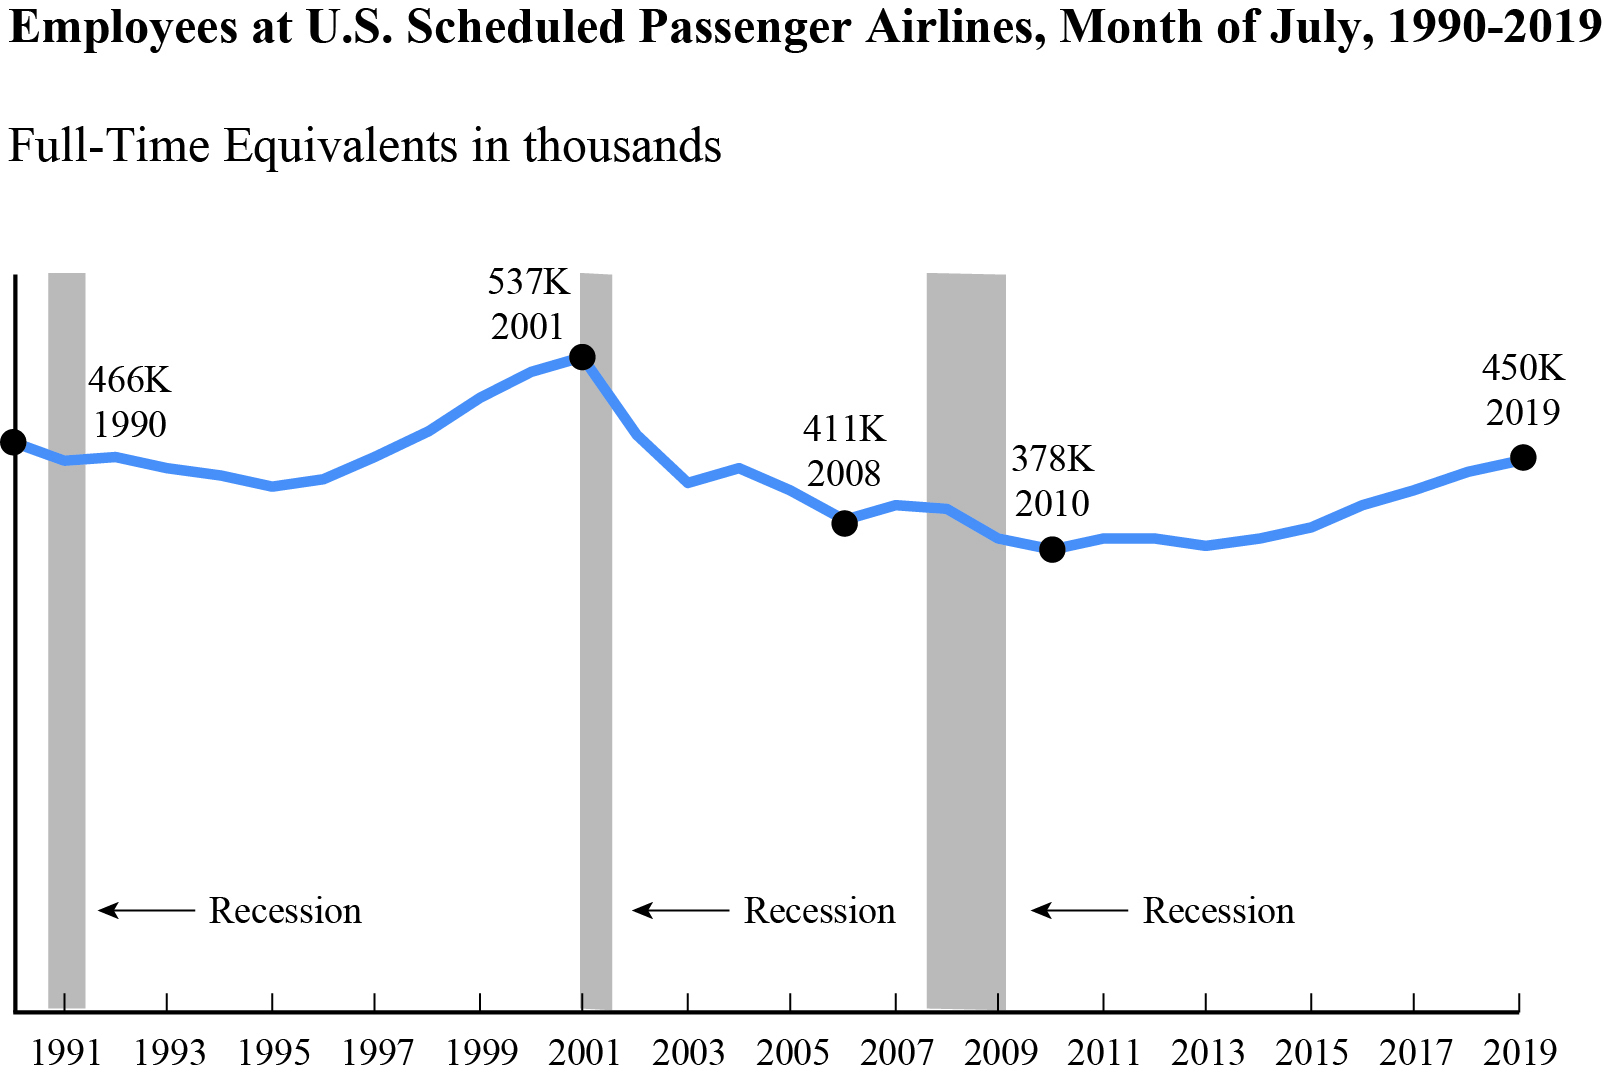
Sept 17 BTS reported that U.S. scheduled passenger airlines employed 1.5% more workers in July 2019 than in July 2018:
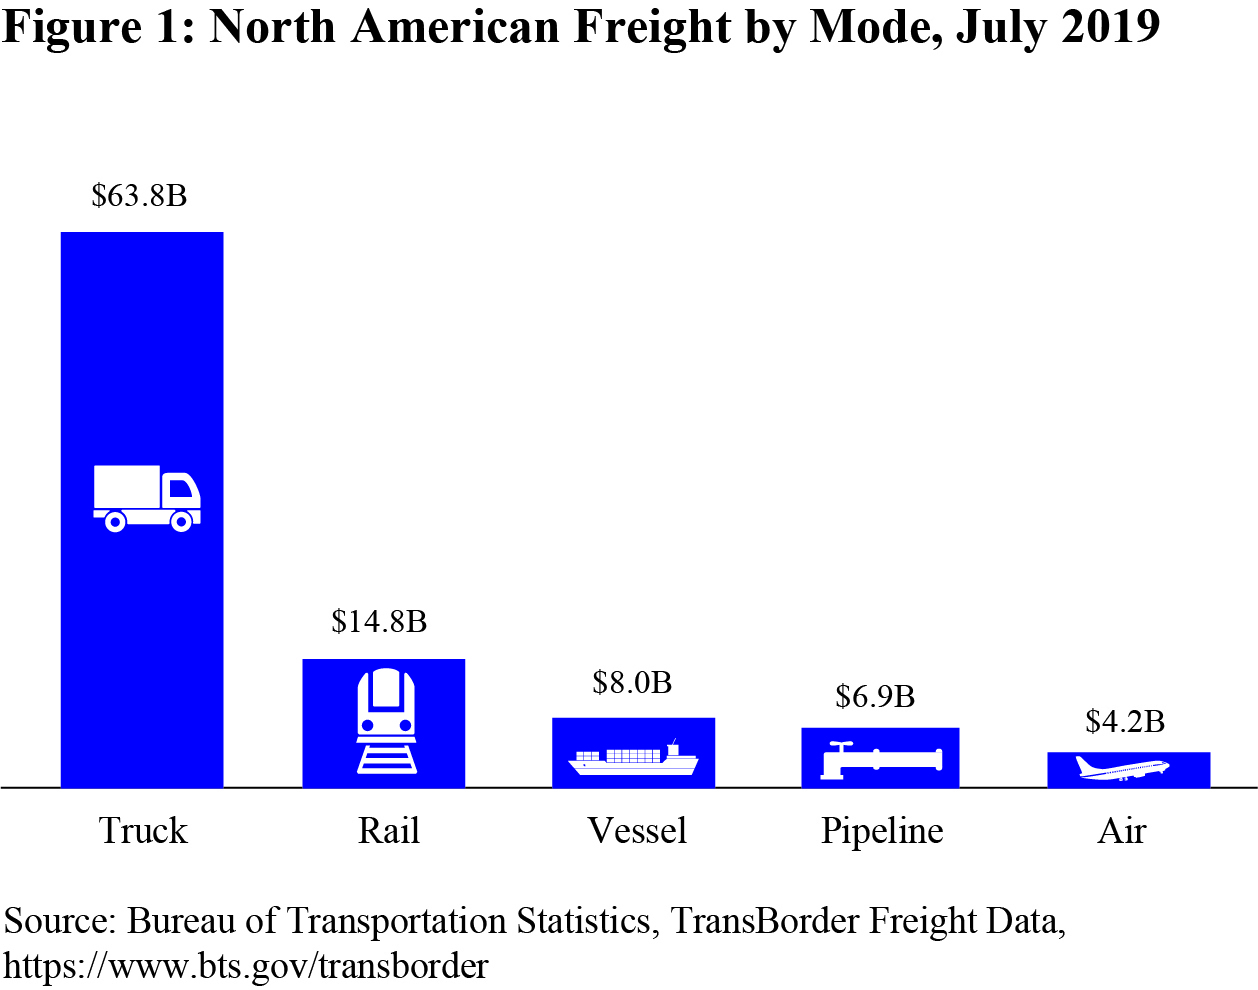
Sept 24 BTS reported that truck was the most used mode for shipping freight between the U.S. and other North American countries (Canada and Mexico) in July 2019:
Sept 25 BTS released a new interactive map that documents the rapid growth of bikeshare (docked and dockless) and e-scooter systems across the country from 2015 to 2019. The total number of these systems has reached almost 300 serving more than 200 cities as of July 2019.
BTS Contact: Dave Smallen 202-366-5568
| ||||||||||||||||||
Bureau of Transportation Statistics Upcoming Releases


Subscribe to:
Post Comments (Atom)
No comments:
Post a Comment