BTS 2-Week Outlook Bureau of Transportation Statistics Upcoming Releases March 29 – April 9 Upcoming from March 29
Tuesday, April 6, 2021 - 11:00am ET Airline Fuel Cost and Consumption, February 2021
Thursday, April 8, 2021 - 11:00am ET Airline Full-Time/Part-Time Employment, February 2021
Previously Released March 17 - Passenger Airline Employment, January 2021 March 18 - U.S. and Foreign Airline Annual Traffic, 2020 March 18 - U.S. Airline Cargo, January 2021 (preliminary) March 24 - North American Freight Data, January 2021 March 26 – Airline On-Time/Tarmac Data, January 2021
BTS Releases in the Next Two Weeks
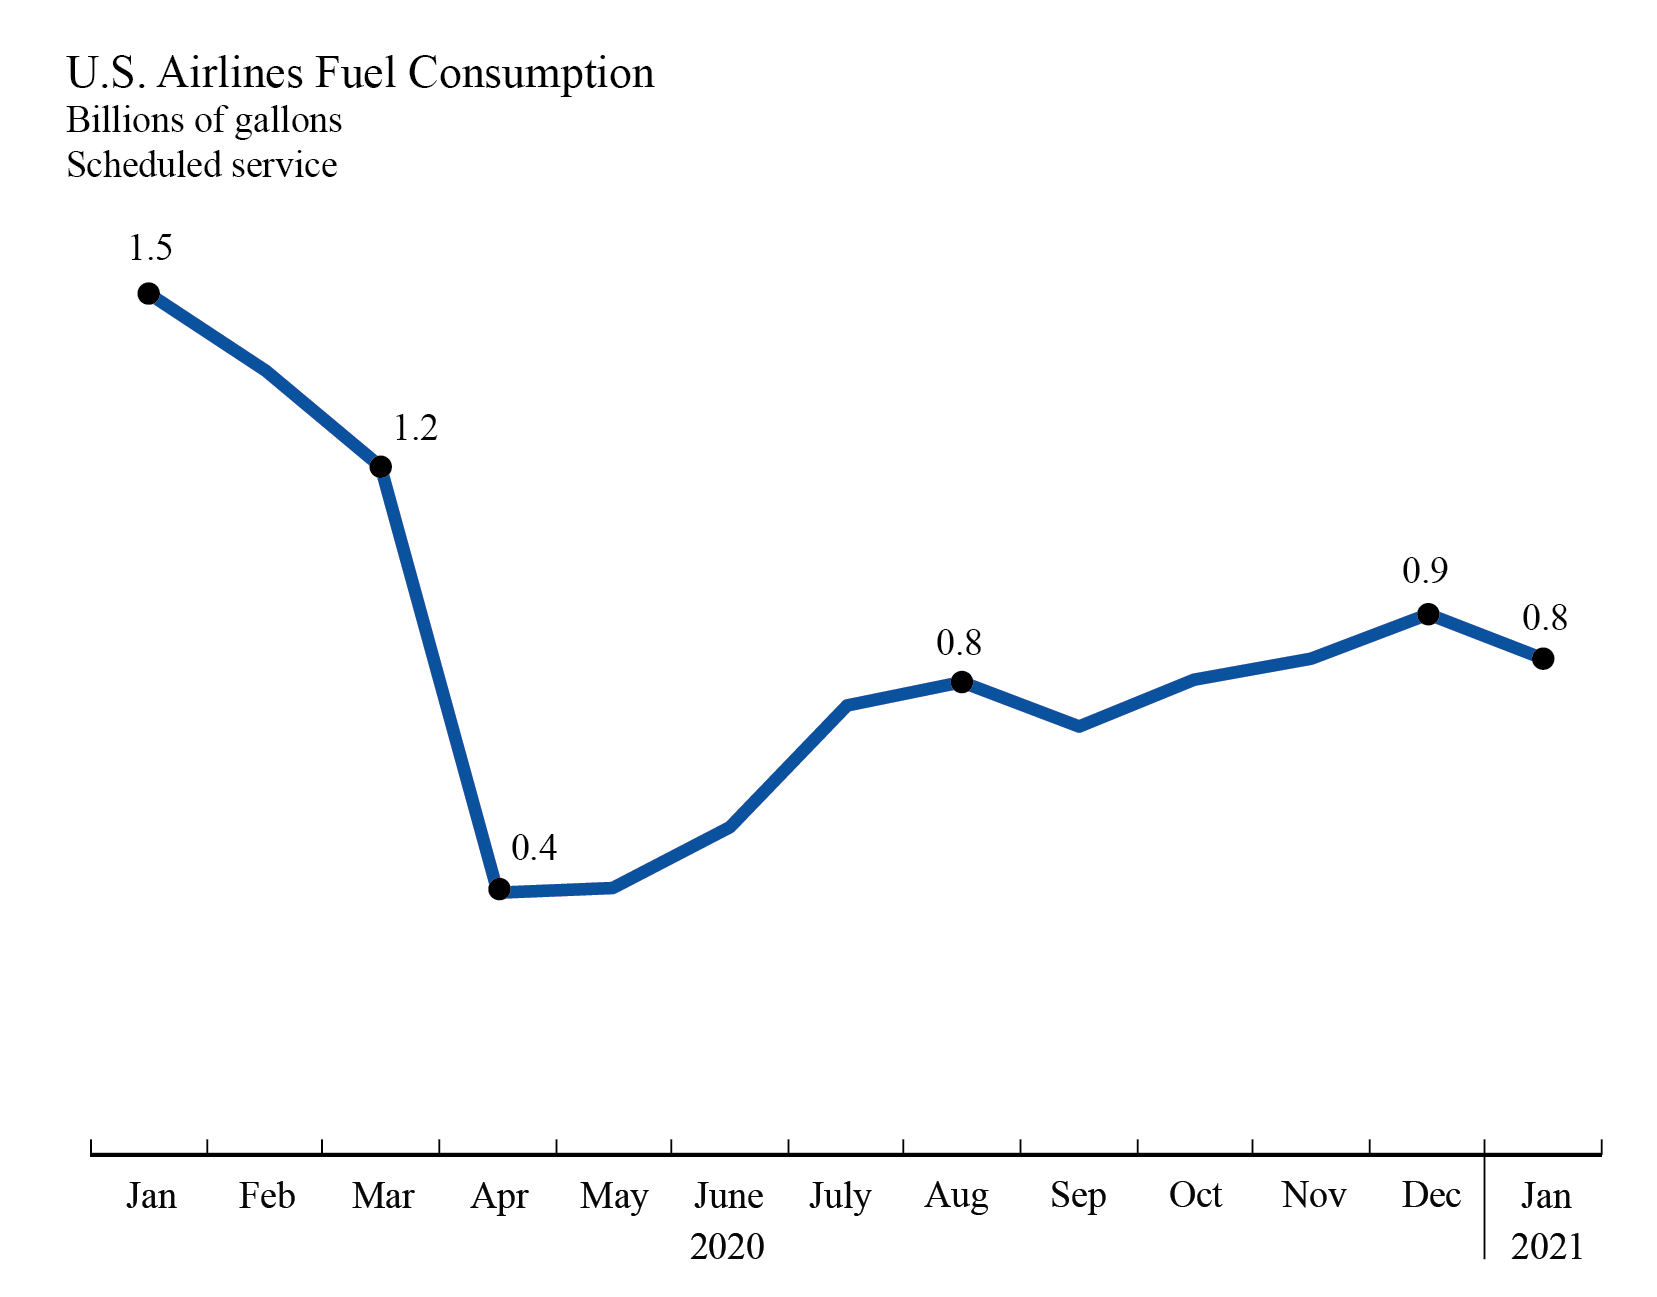
Tuesday, April 6, 2021 - 11:00am ET Previous release: U.S. airlines January 2021 fuel consumption was 8% lower than December 2020 and almost double consumption in April 2020. April was the lowest monthly fuel usage on record (447M gallons), dating back to 2000. January 2021 fuel consumption was down 42% from January 2020. Fuel consumed by U.S. airlines' scheduled services: January 2020 1.5 billion gallons December 2020 918 million gallons January 2021 844 million gallons
Industry summary of airline fuel consumption, total fuel cost and price paid per gallon are available on the database. Individual airline numbers through September are available on the BTS website. Individual airline numbers for October, November and December will be available on May 3. Individual airline numbers for January and February will be available on June 14.
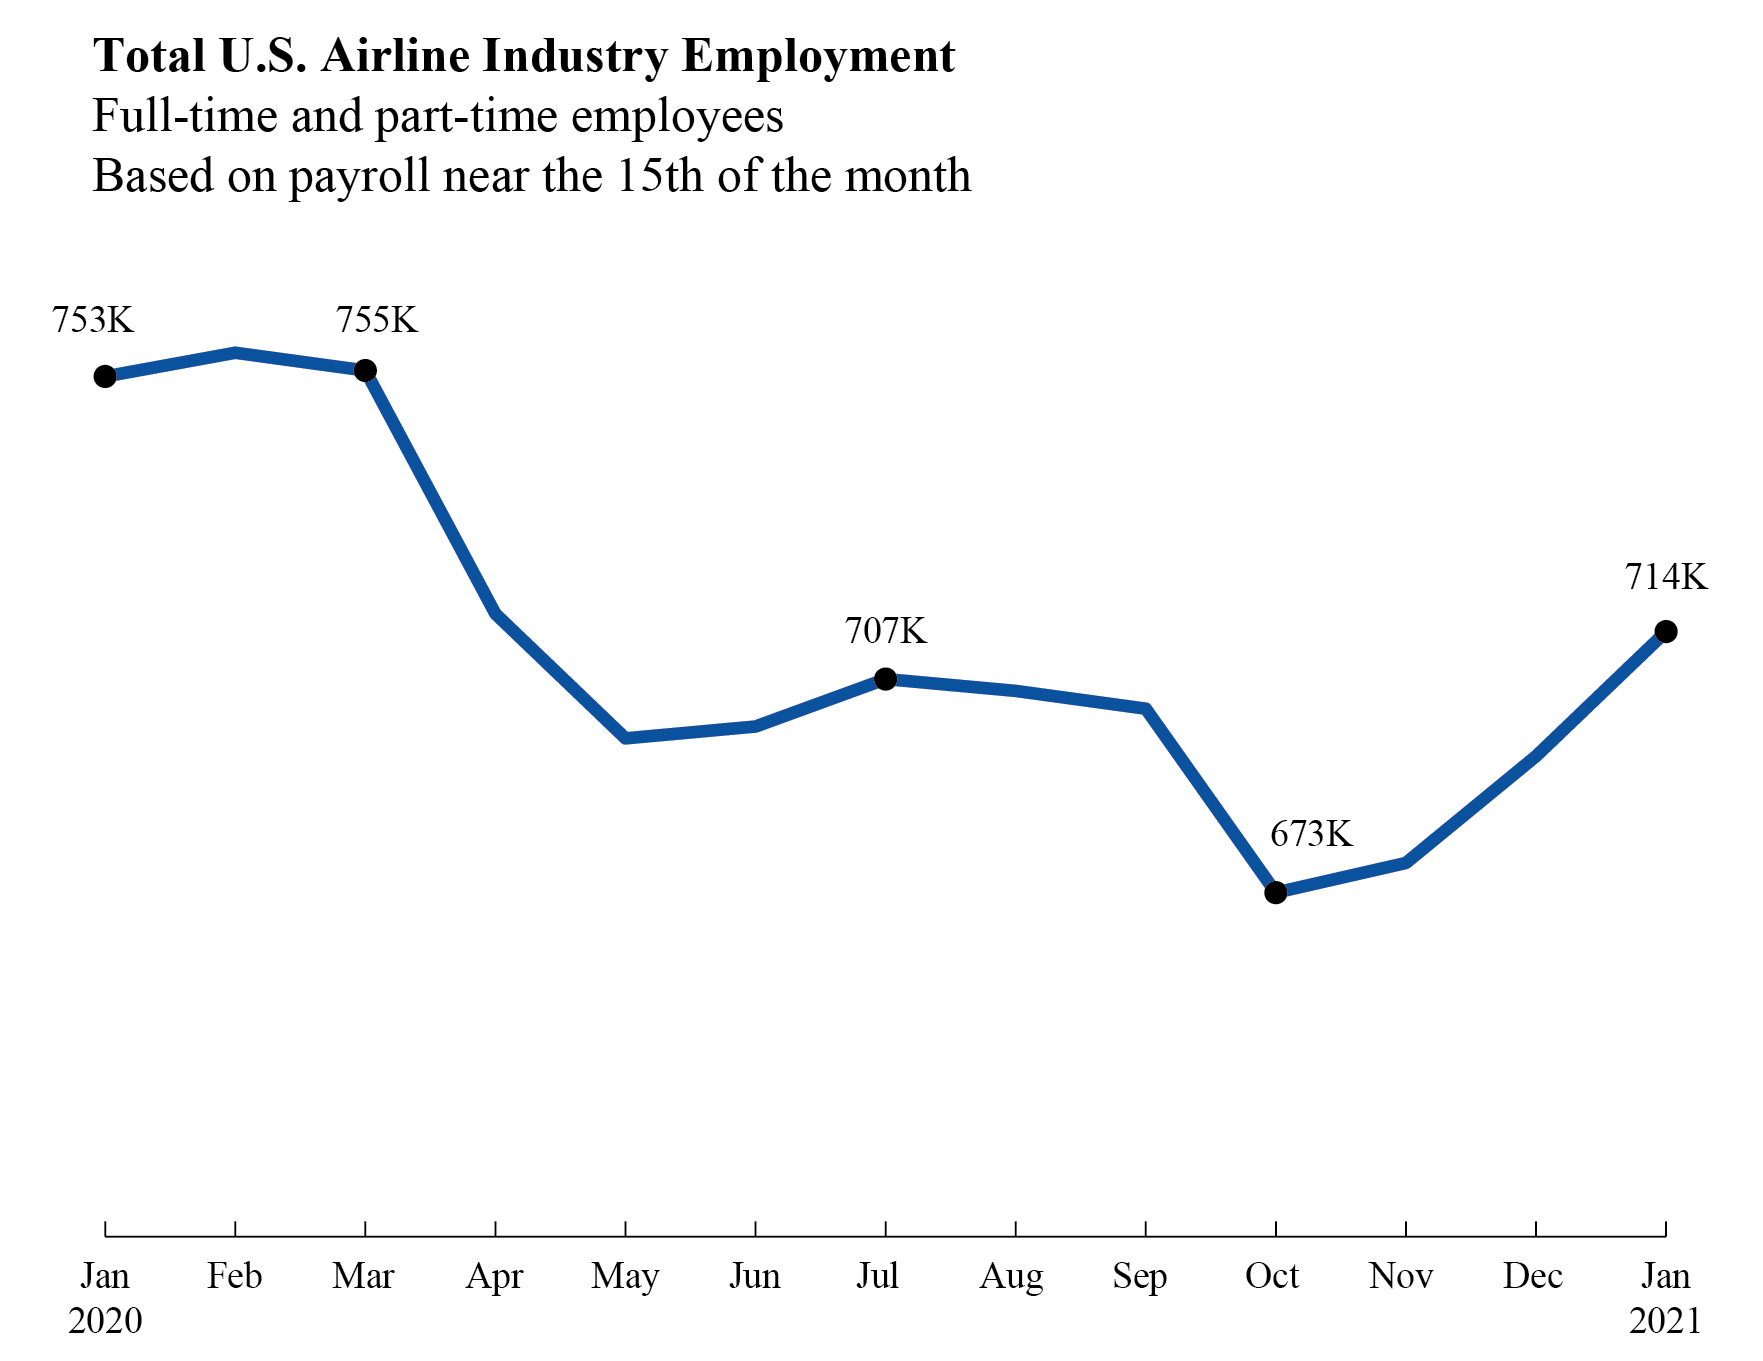
Thursday, April 8, 2021 - 11:00am ET Previous release: U.S. airlines employed 713,949 workers in the middle of January 2021, 19,311 more than in mid-December 2020 (694,638) but 41,078 fewer than in March 2020 (755,027). The January total was the highest since April (716,693). Total employment (full-time + part-time) by all U.S. airlines including scheduled passenger, charter and cargo: January 2020 753,404 December 2020 694,638 January 2021 713,949 Regulations require airlines to report employment numbers for a pay period near the 15th of the month. Monthly full-time and part-time employment statistics are reported by U.S. airlines that operate at least one aircraft that has more than 60 seats or the capacity to carry a payload of passengers, cargo and fuel weighing more than 18,000 pounds.
BTS Previously
BTS has released the following:
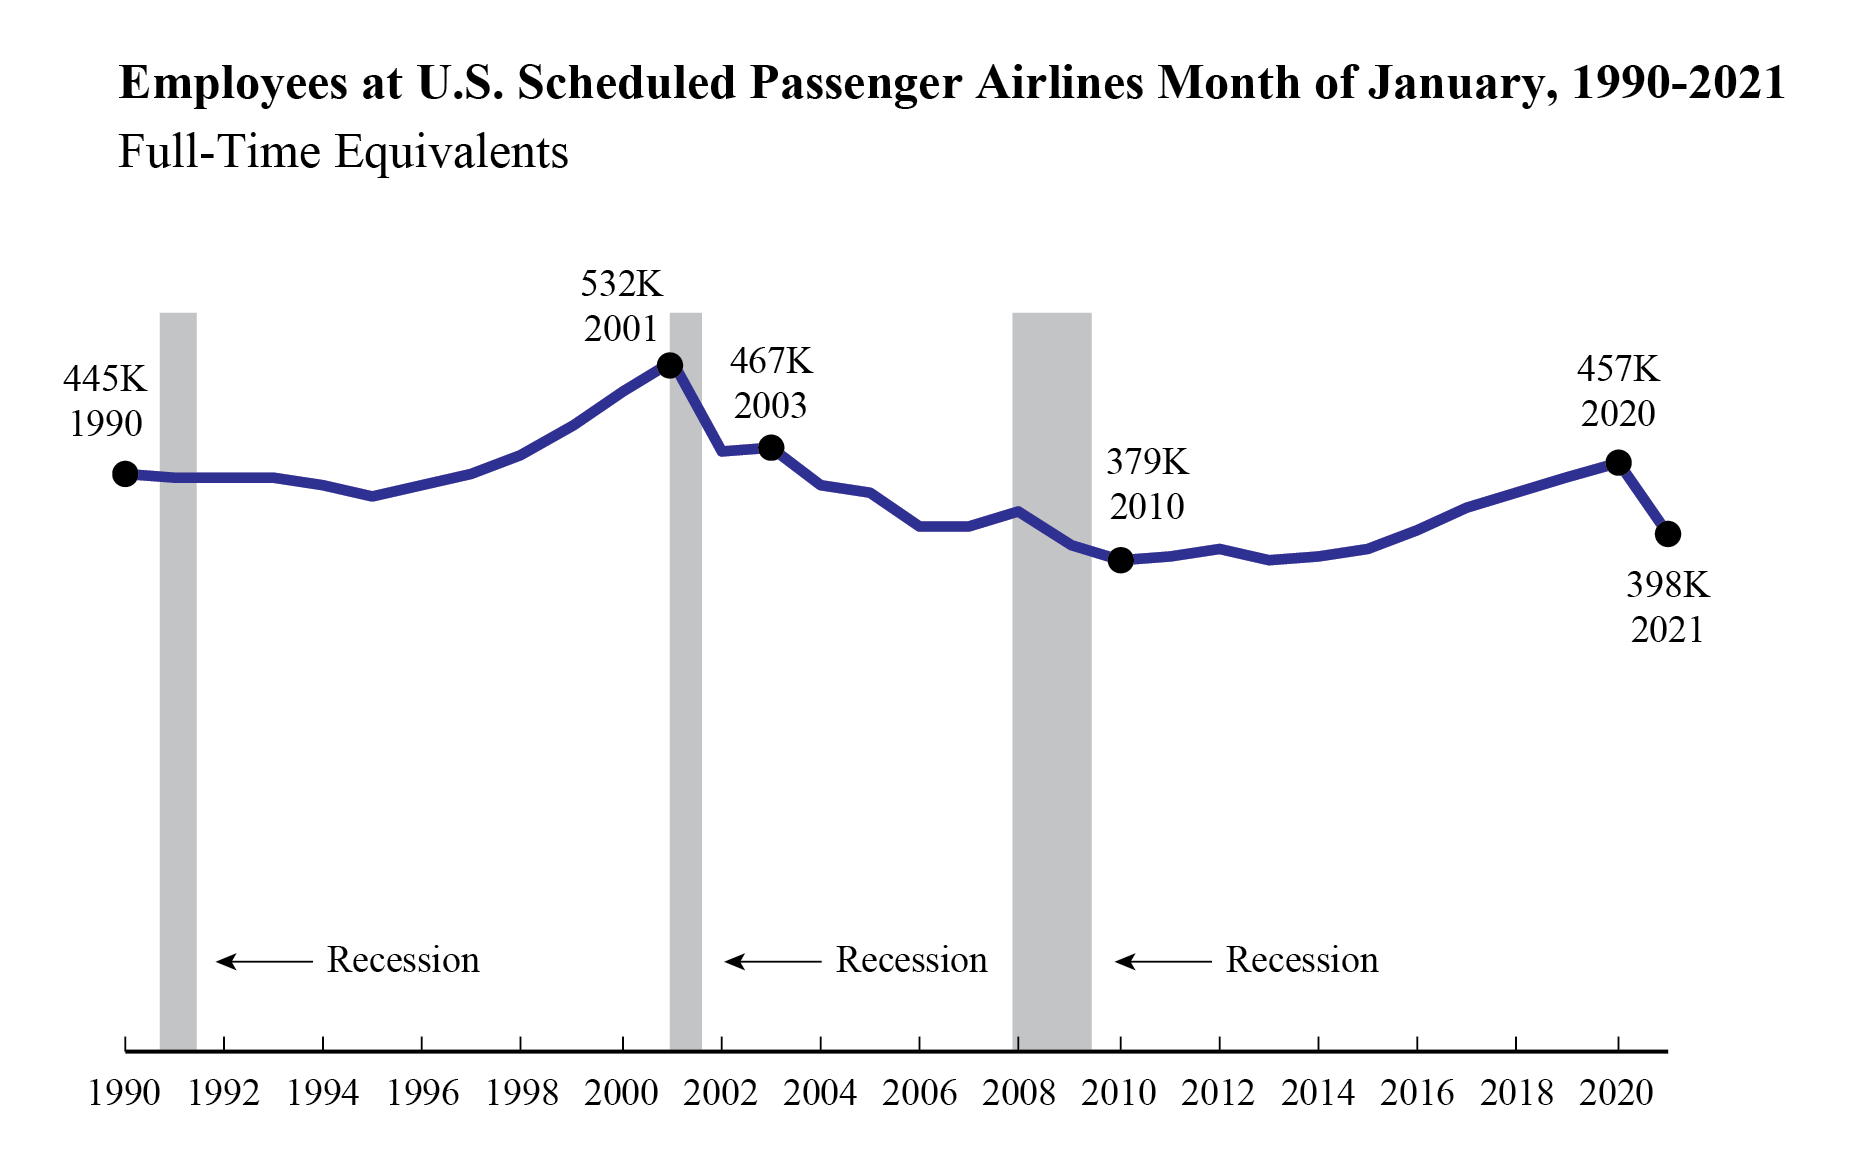
Released March 17 BTS reported that 20 U.S. scheduled passenger airlines employed 4.9% more full-time equivalents (FTEs) in mid-January 2021 than in mid-December 2020.
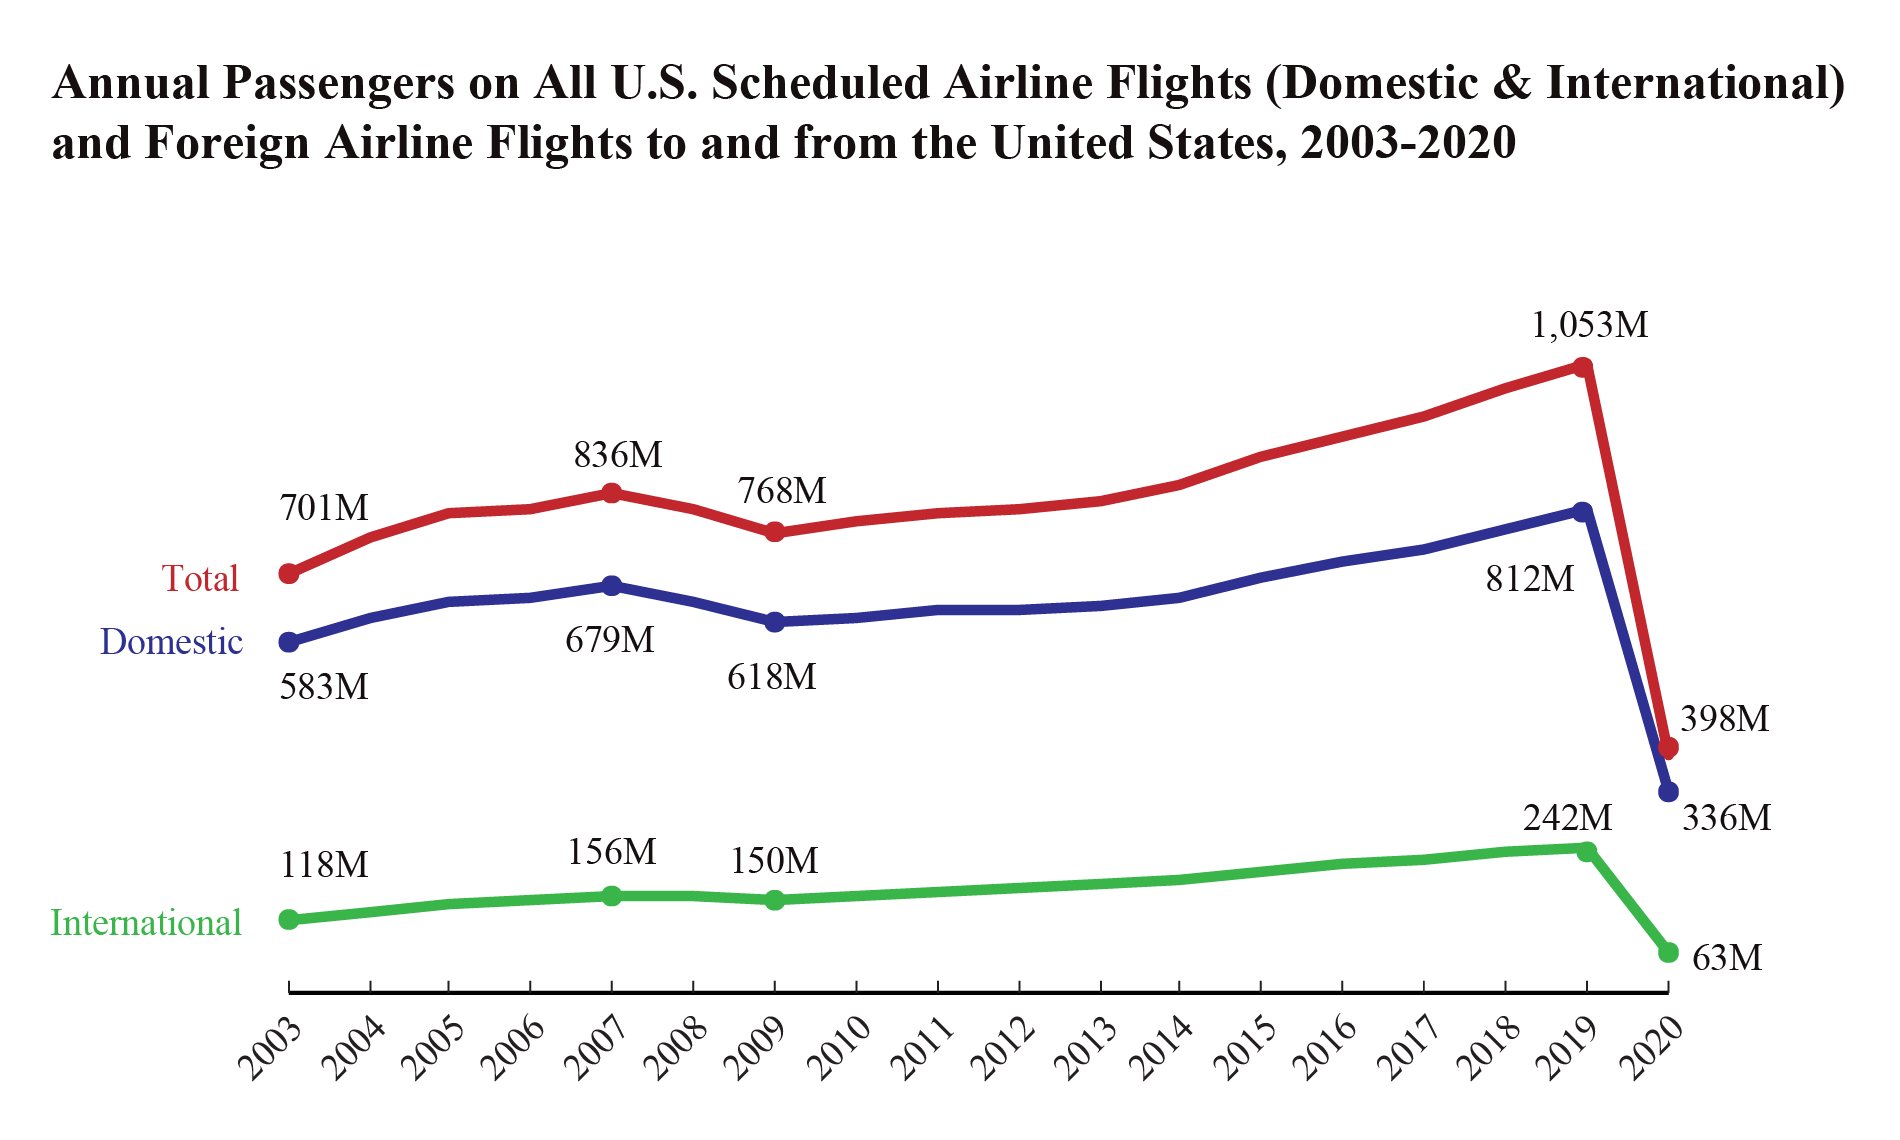
Released March 18 U.S. airlines and foreign airlines serving the U.S. carried 398 million systemwide (domestic and international) scheduled service passengers in 2020, 62% fewer than in 2019 when the record high of 1.1 billion annual passengers was reached.
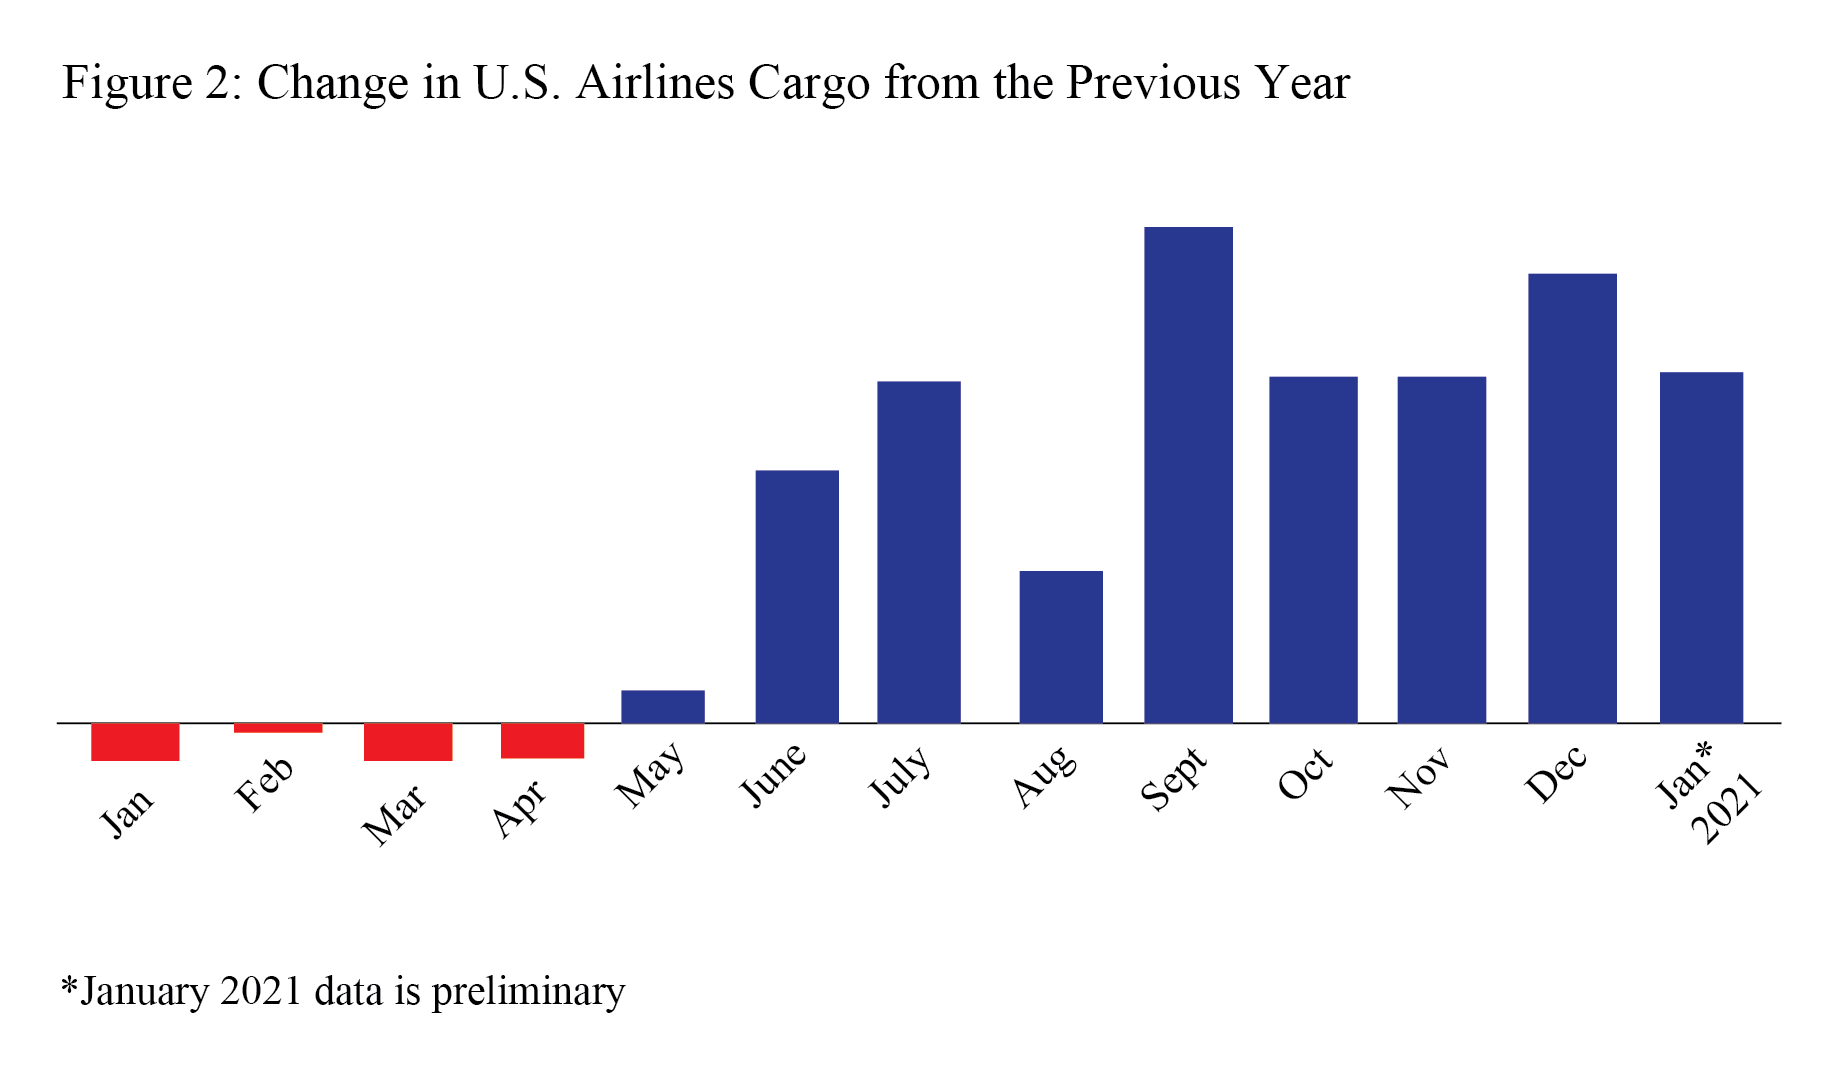
Released March 18 U.S. airlines carried 13% more cargo by weight in January 2021 (preliminary) than in January 2020. The rise was fueled by gains of 12% in domestic cargo and 15% in international cargo, according to data filed by 14 of the leading cargo airlines. The 14 airlines carry 95% of the total cargo by weight on U.S. airlines. Cargo data consists of freight and mail carried within the U.S. and between the U.S. and foreign points.
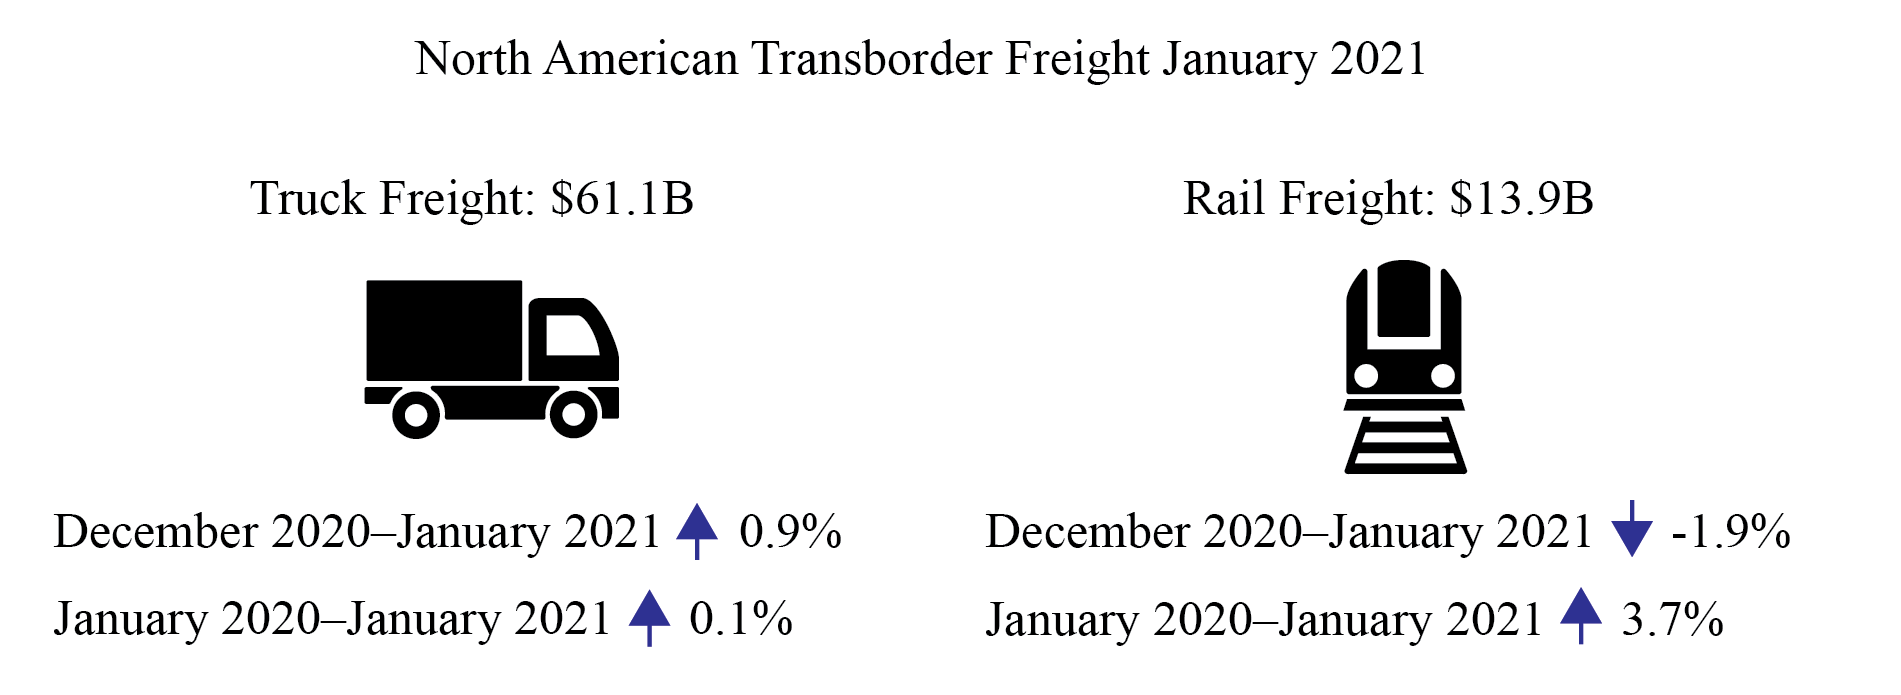
Released March 24 Freight between the U.S. and other North American countries (Canada and Mexico) in January 2021:
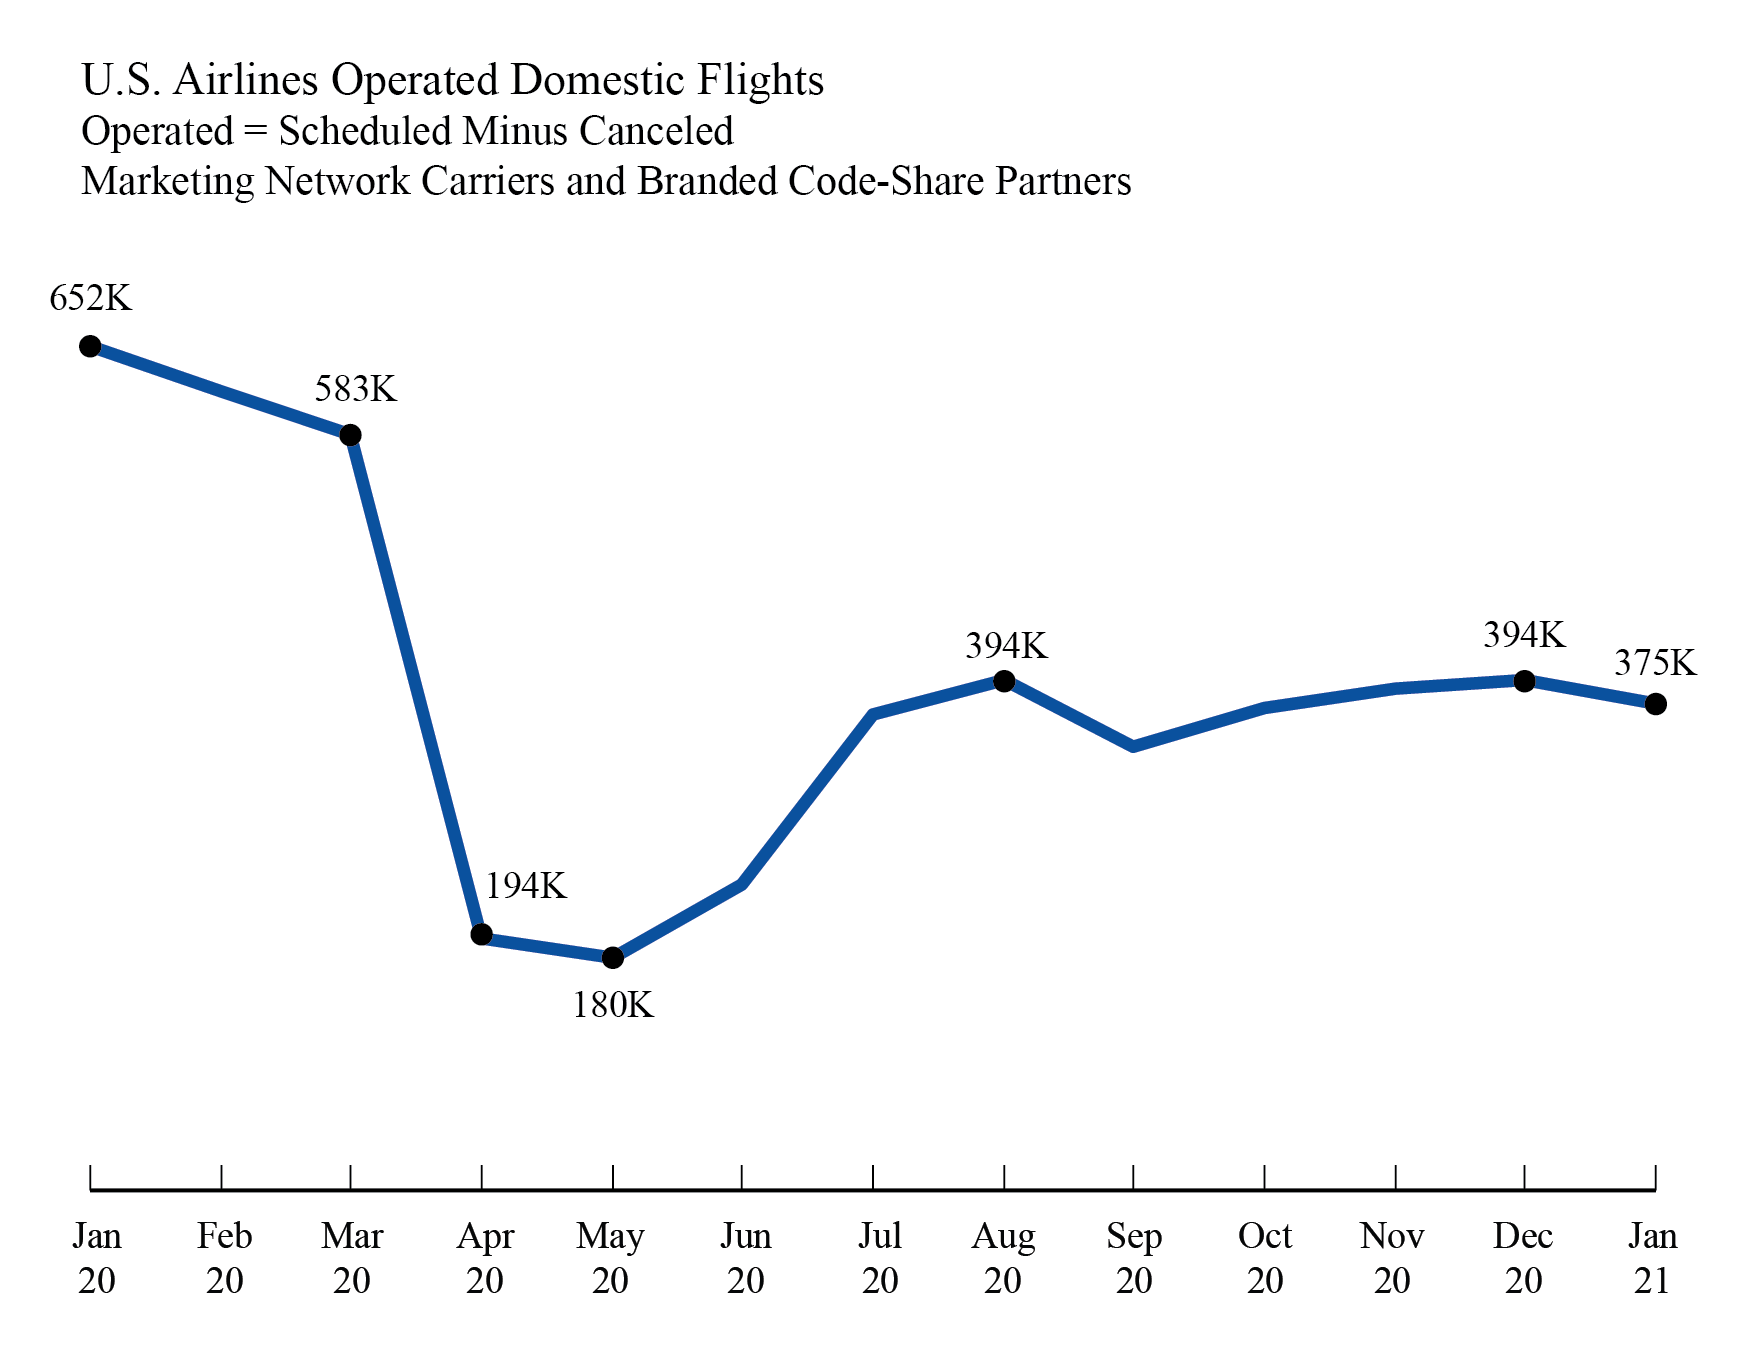
Released March 26 The 10 marketing network carriers reported 379,384 scheduled domestic flights in January 2021 compared to 397,802 flights in December 2020 and 660,556 flights in January 2020. Of those 379,384 scheduled flights, 1.1%, 4,155 flights, were canceled. As a result of schedule reductions and cancellations, the carriers reported operating 375,229 flights in January 2021, compared to 393,549 flights in December 2020 and the all-time monthly low of 180,151 flights in May 2020. Airlines operated 652,140 flights in January 2020. The marketing carriers include branded code-share partners of mainline carriers.
BTS Contact: Dave Smallen 202-366-5568
| ||||||||||||||||||
BTS 2-Week Outlook: Bureau of Transportation Statistics Upcoming Releases March 29 – April 9


Subscribe to:
Post Comments (Atom)
No comments:
Post a Comment