BTS 2-Week OutlookBureau of Transportation Statistics Upcoming Releases:April 28 - May 7Upcoming from April 27 Wednesday, April 28, 2021 - 11:00am ET Thursday, April 29, 2021 11:00am ET Monday, May 3, 2021 - 11:00am ET Wednesday, May 5, 2021 - 11:00am ET Thursday, May 6, 2021 - 11:00am ET
Previously Released April 13 – U.S. Airlines Passengers, February 2021 (preliminary) April 14 – Freight Transportation Services Index, February 2021 April 15 - Airline Traffic Data, January 2021 Domestic, October 2020 International April 19 - Passenger Airline Employment, February 2021 April 20 – Average Domestic Air Fares, Annual and 4th Quarter 2020 April 21 - Airline On-Time/Tarmac Data, February 2021 April 21 - U.S. Airline Cargo, February 2021 (preliminary)
BTS Releases in the Next Two WeeksNorth American Transborder Freight Data, February 2021 The release summarizes the monthly value of freight transported by truck, rail and other modes between the U.S. and Canada and the U.S. and Mexico with the top states, ports and commodities. Previously, BTS reported that the value of total Transborder freight in January 2021 was $94 billion, down 2.6% compared to December 2020 and virtually unchanged compared to January 2020. Previous release
National Transportation Atlas Database, Spring Update Previously, the National Transportation Atlas Database (NTAD) winter update was released with two new datasets and six updated datasets. NTAD is a Bureau of Transportation Statistics (BTS) compilation of geospatial datasets representing the nation's transportation infrastructure, containing roadways, railways, waterways, and airports. The two new datasets in this version are the National Network of more than 200,000 miles of highways and the North American Roads network. The updates in this release include Fatality Analysis Reporting System (FARS) with 2019 values; Truck Parking; Alternative Fueling Stations; National Parks; Metropolitan Planning Organization (MPO) boundaries; Congressional Districts with names of members updated through Jan. 8. Previous release
S. Airline Financial Data, Annual and 4th Quarter 2020 The release summarizes annual and quarterly net profit, operating profit, operating revenue and operating expenses for the U.S. scheduled service passenger airlines for systemwide, domestic and international operations. The BTS third quarter 2020 release said that U.S. scheduled passenger airlines reported an after-tax net loss of $11.8 billion and a pre-tax operating loss of $15.9 billion. Additional financial numbers for all airlines will be available on the BTS financial databases. Previous release
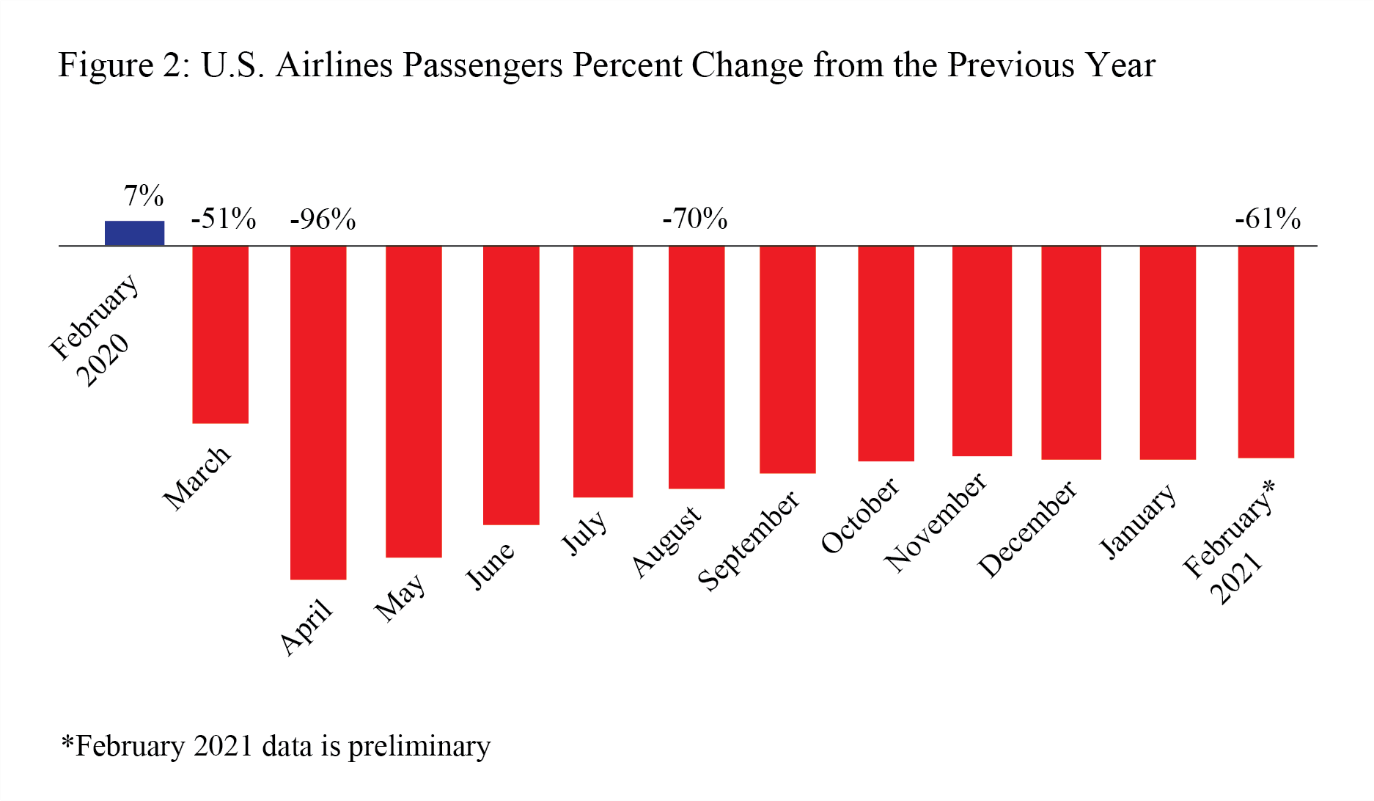
Airline Fuel Cost and Consumption, March 2021 Previous release: U.S. airlines February 2021 fuel consumption was 10% lower than January 2021 and 69% more than consumption in April 2020. April was the lowest monthly fuel usage on record (447M gallons), dating back to 2000. February 2021 fuel consumption was down 43% from February 2020. Fuel consumed by U.S. airlines' scheduled services: February 2020 1.3 billion gallons Industry summary of airline fuel consumption, total fuel cost and price paid per gallon are available on the database. Individual airline numbers through September are available on the BTS website. Individual airline numbers for October, November and December will be available on May 3. Individual airline numbers for January, February and March will be available on June 14. Previous release: U.S. airlines employed 711,554 workers in February 2021, 3,030 fewer than in January 2021 (714,584) but 43,541 fewer than in March 2020 (755,095). The January total was the highest since April (718,385). Total employment (full-time + part-time) by all U.S. airlines including scheduled passenger, charter and cargo: February 2020 756,953 Regulations require airlines to report employment numbers for a pay period near the 15th of the month. Monthly full-time and part-time employment statistics are reported by U.S. airlines that operate at least one aircraft that has more than 60 seats or the capacity to carry a payload of passengers, cargo and fuel weighing more than 18,000 pounds. BTS Previously During the previous two weeks, BTS has released the following: S. Airline Passengers, February 2021 (Preliminary) U.S. airlines carried 61% fewer scheduled service passengers in February 2021 than in February 2020, according to data filed with the Bureau of Transportation Statistics (BTS) by 22 airlines that carry more than 90% of the passengers. February was the fifth straight month of year-over-year declines slightly above 60%.
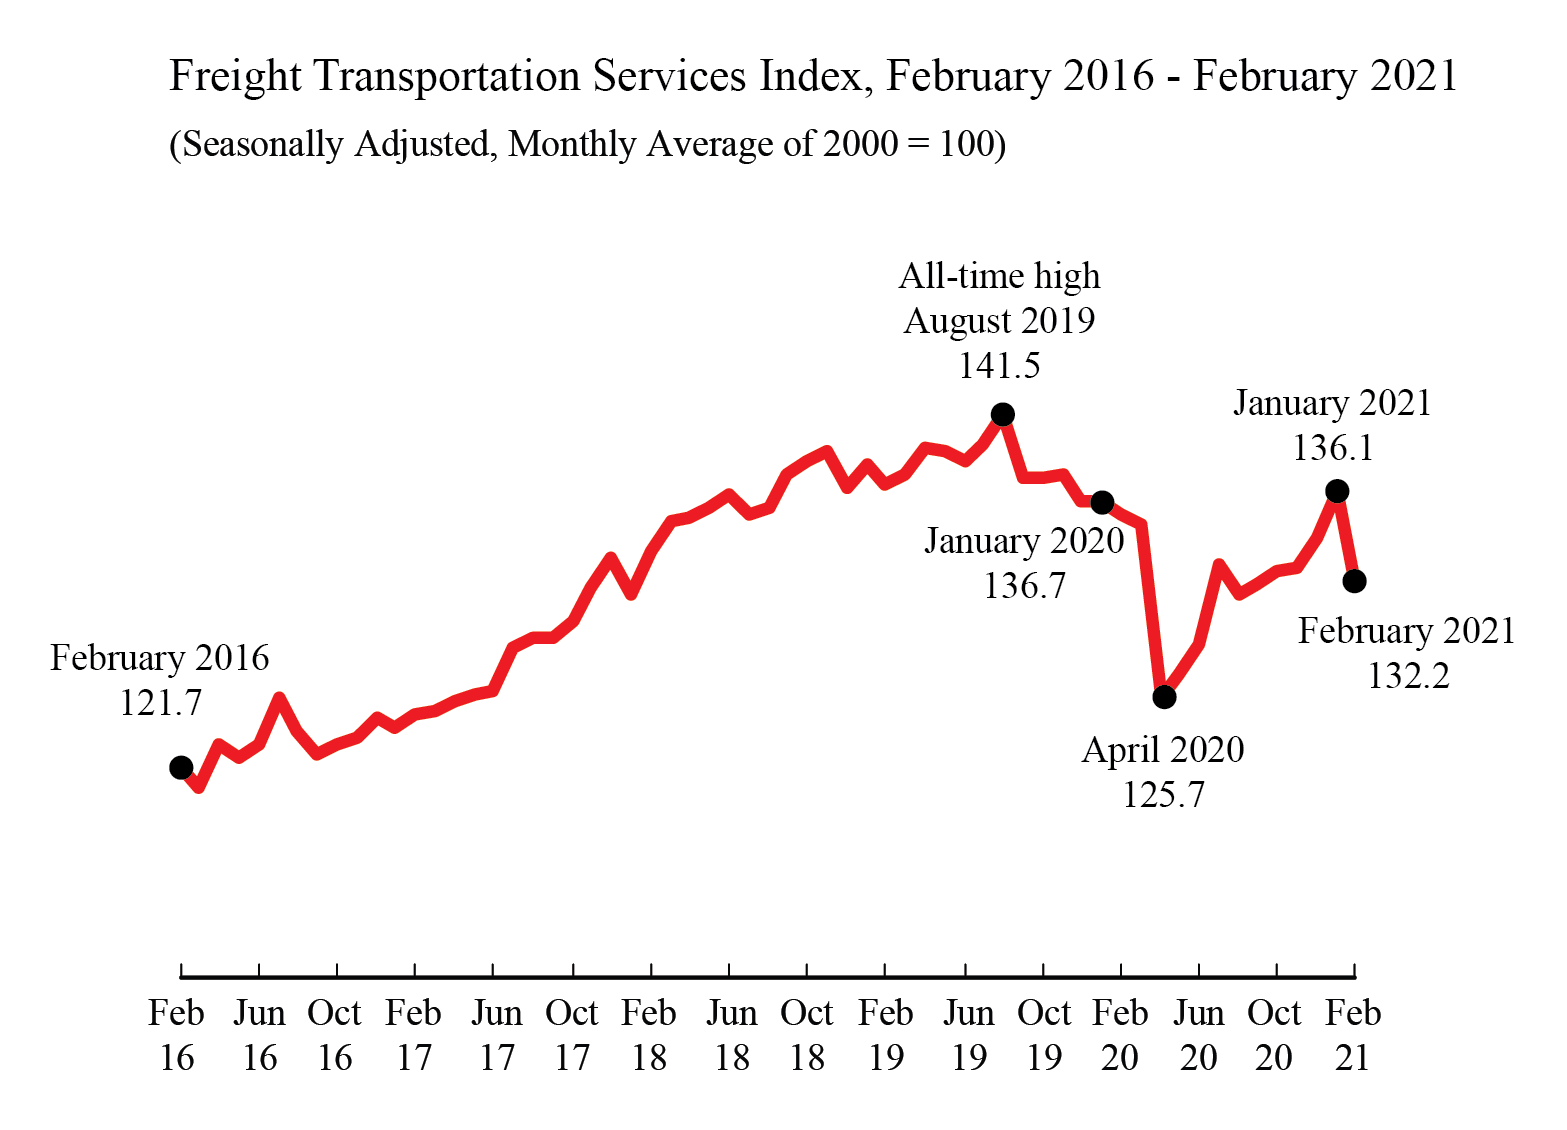
Freight Transportation Services Index (TSI), February 2021 The Freight Transportation Services Index (TSI), which is based on the amount of freight carried by the for-hire transportation industry, declined 3.6% in February from January, falling to its lowest level since September. The decline in February followed five consecutive months of growth. From February 2020 to February 2021 the index fell 2.7% compared to a decline of 1.2% from February 2019 to February 2020 and an increase of 2.7% from February 2018 to February 2019. Release
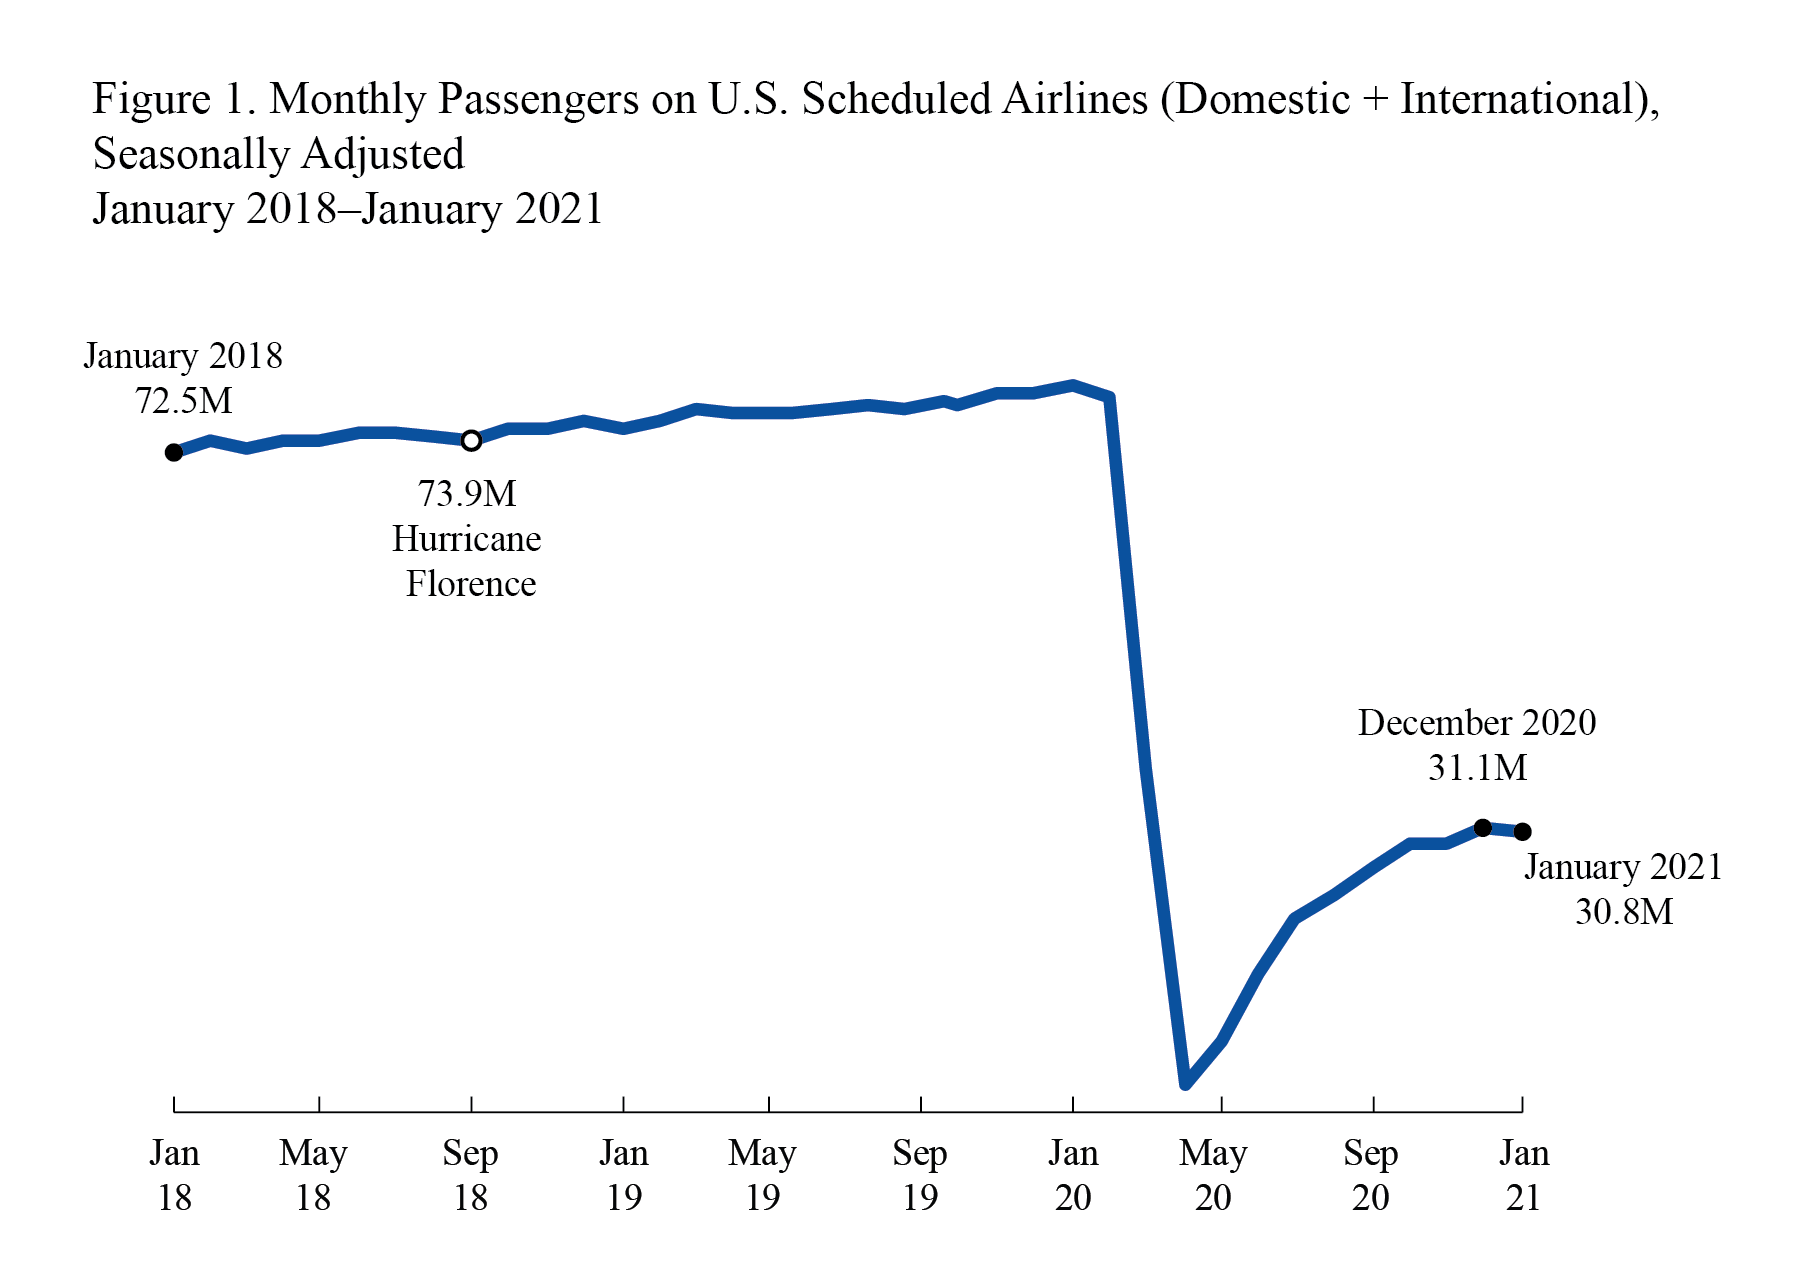
Airline Traffic Data, January 2021 final U.S. airlines carried 30.8 million systemwide (domestic and international) scheduled service passengers in January 2021, seasonally adjusted, down 0.9% from December., U.S. airlines carried 27.7 million domestic passengers and 3.1 million international passengers in January.
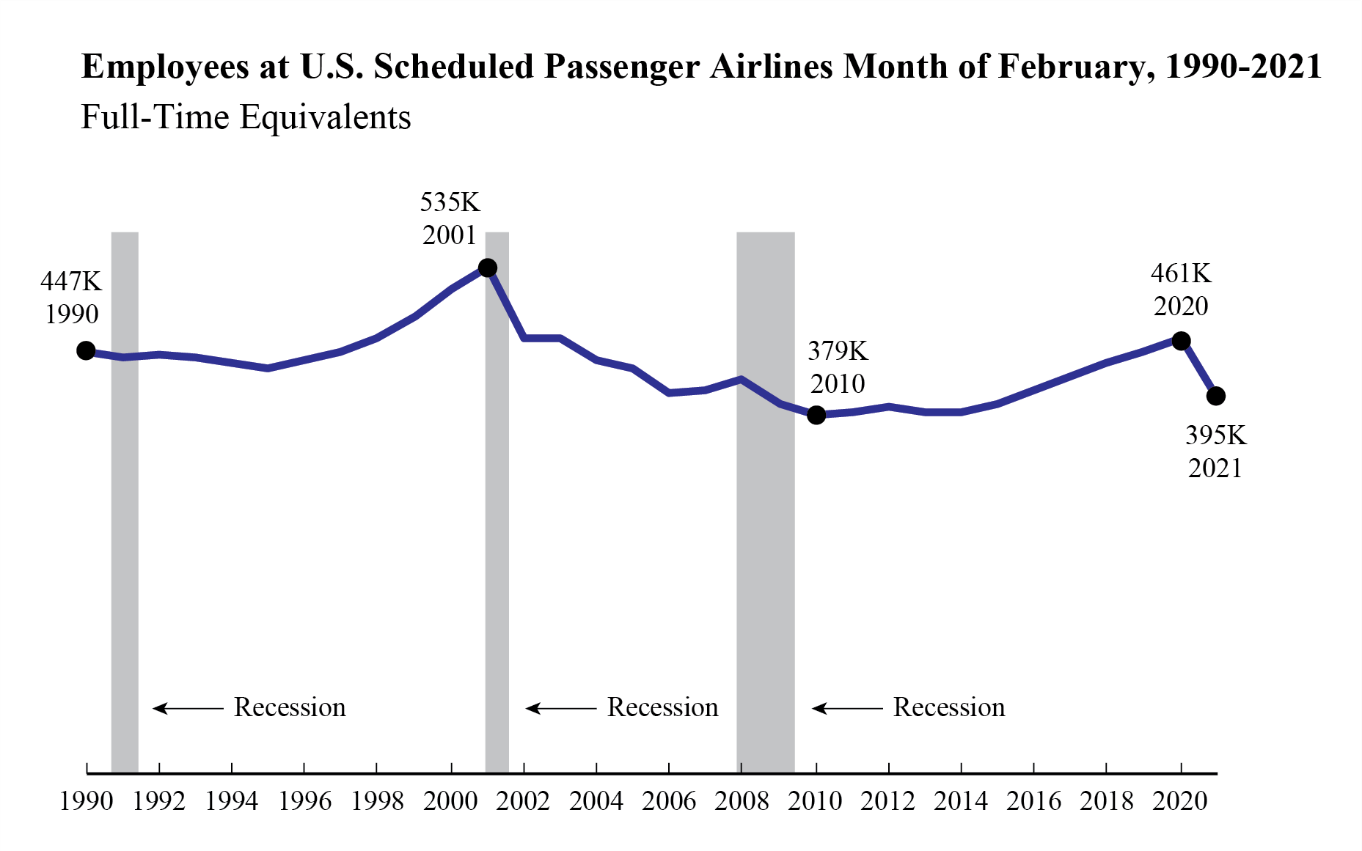
Passenger Airline Employment, February 2021 BTS reported that 20 U.S. scheduled passenger airlines employed 0.8% fewer full-time equivalents (FTEs) in February 2021 than in January 2021.
The decline from January resulted from United Airlines reduction of 6,158 FTEs. Other passenger airlines reported an increase in FTEs from January to February.
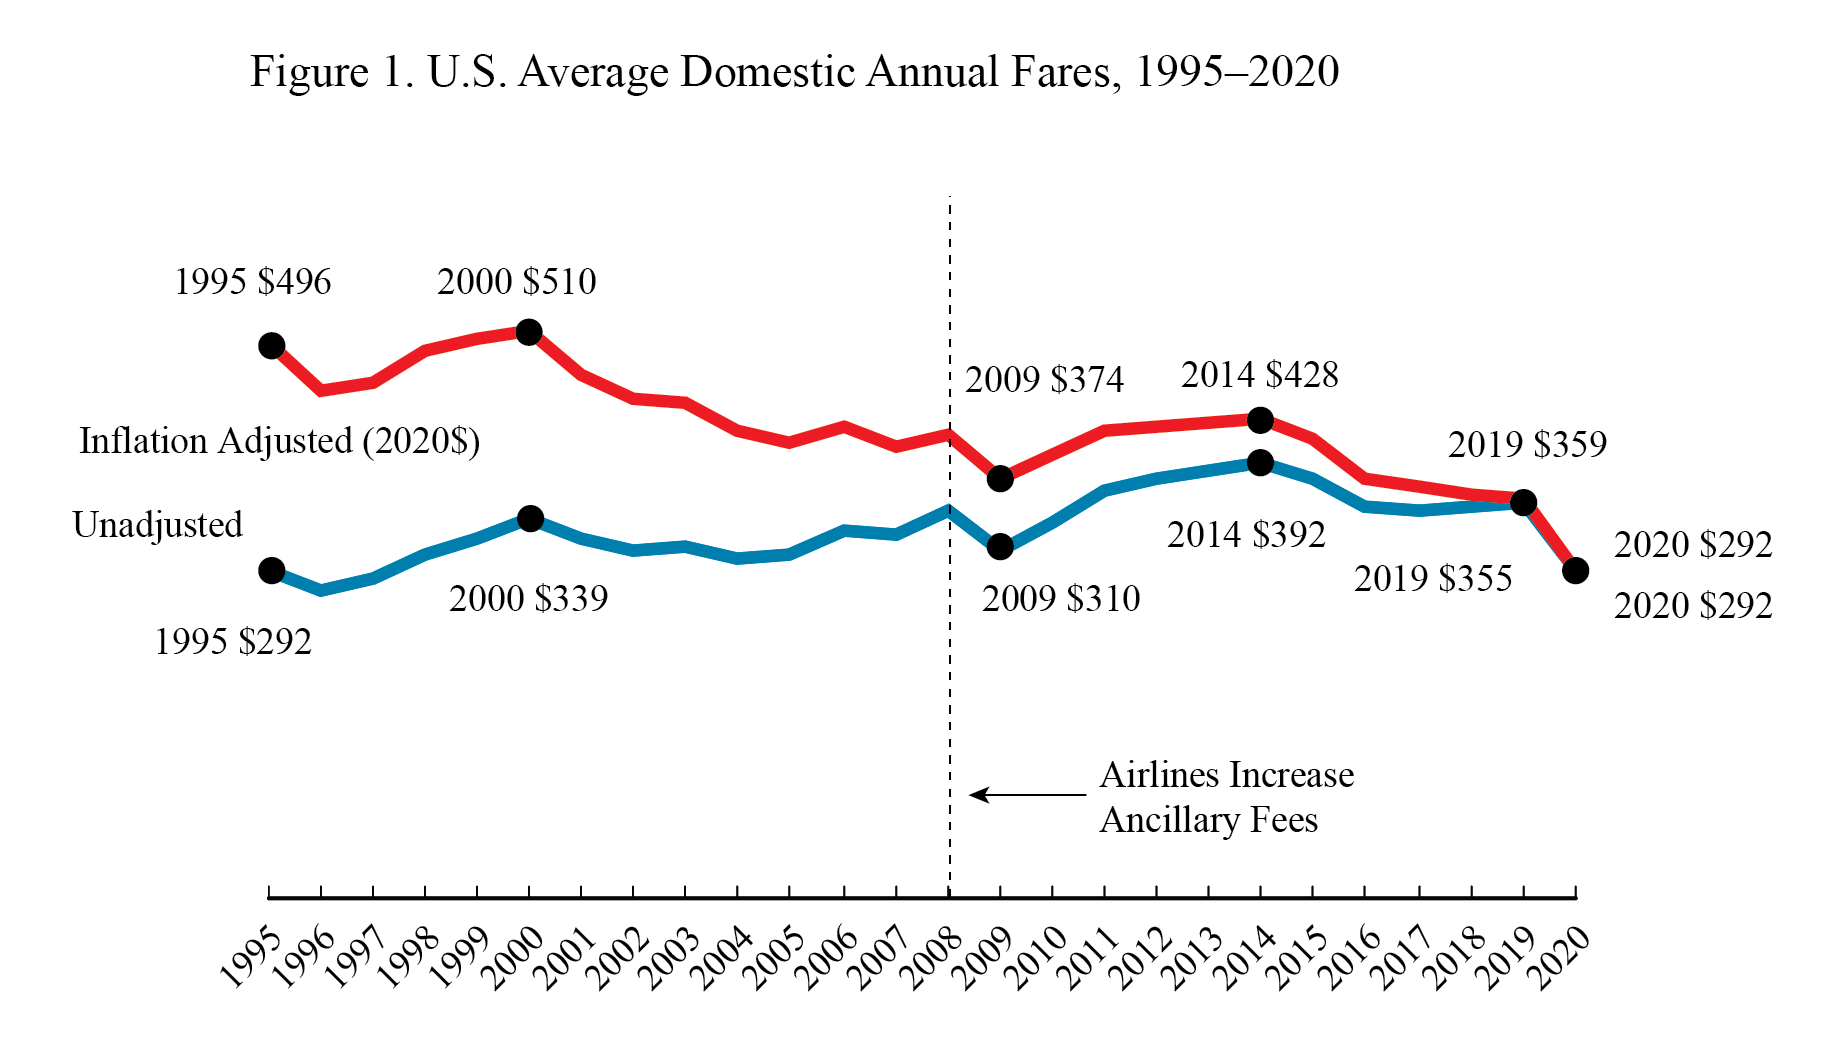
Average Air Fares, Annual and 4th Quarter 2020 The 2020 average domestic itinerary air fare of $292 was the lowest inflation-adjusted annual fare since BTS began collecting such records in 1995, down 19% from the previous low of $359 in 2019. In 2020, 131 million originating passengers traveled on U.S. airlines, down from 331 million in 2019. During the year, fares dropped in the third quarter to $245, inflation-adjusted, the lowest quarterly fare on record. In the fourth quarter, fares rose to $261, up 6% from the third quarter but down 28% from the fourth quarter 2019 average fare of $361.
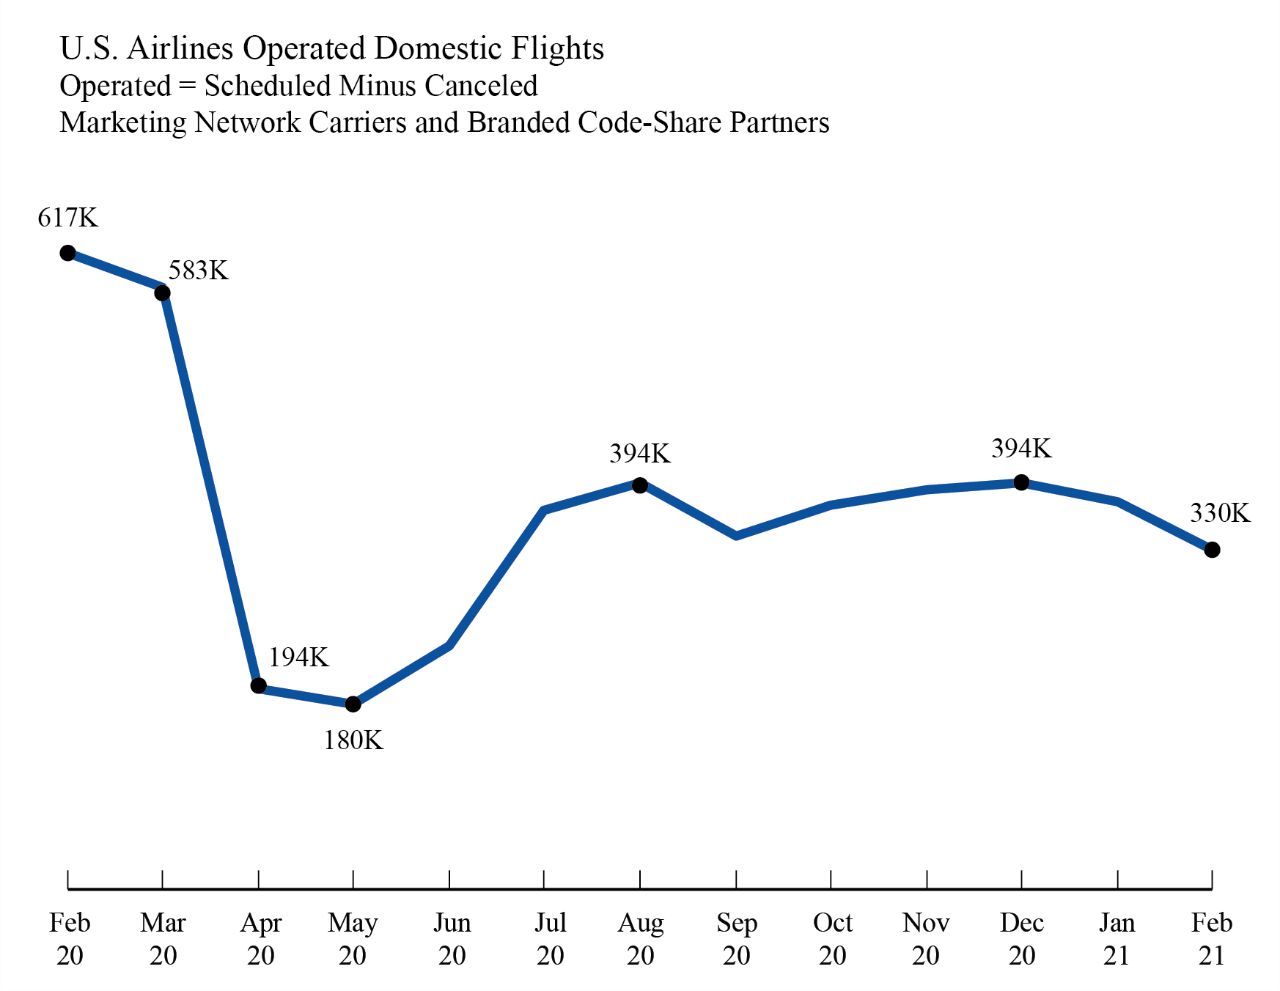
Airline On-Time/Cancellation Data, February 2021 The 10 marketing network carriers reported 350,170 scheduled domestic flights in February 2021 compared to 379,384 flights in January 2021 and 623,103 flights in February 2020. Of those 350,170 scheduled flights, 5.8%, 20,201 flights, were canceled. As a result of schedule reductions and cancellations, the carriers reported operating 329,969 flights in February 2021, compared to 375,229 flights in January 2021 and the all-time monthly low of 180,151 flights in May 2020. Airlines operated 617,008 flights in February 2020. The marketing carriers include branded code-share partners of mainline carriers. Release
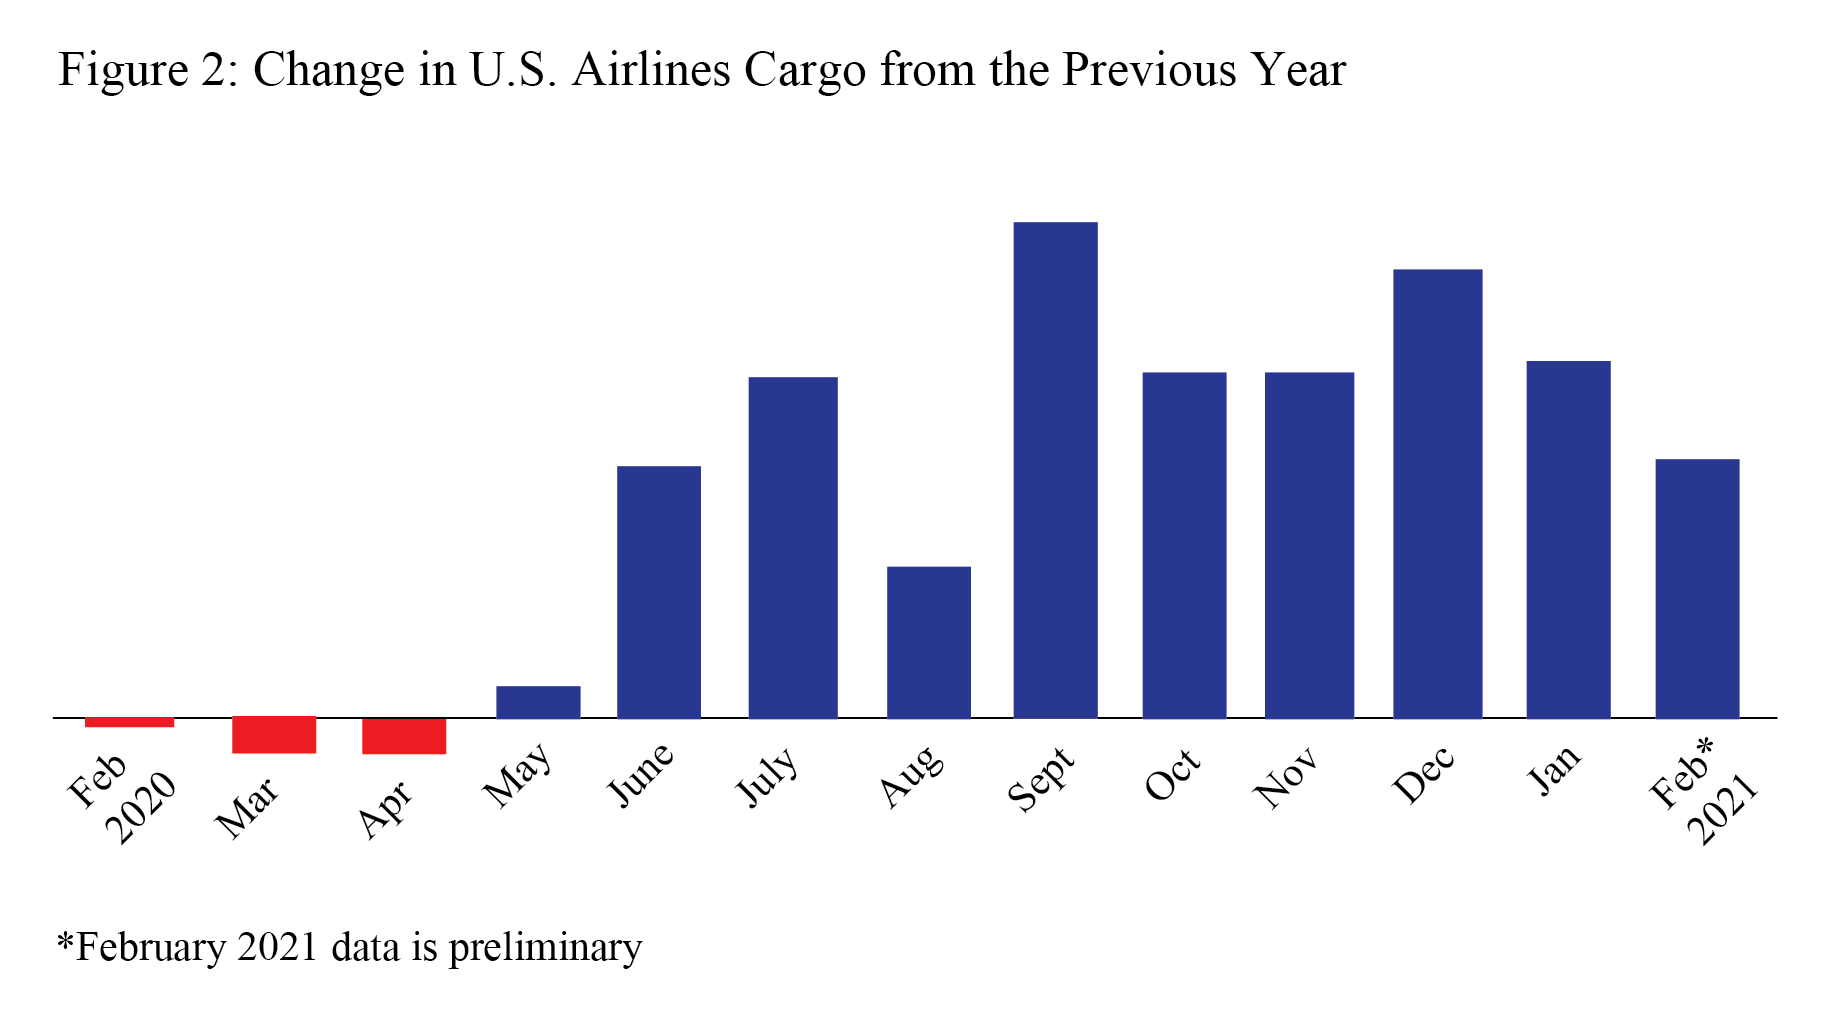
S. Airline Cargo Data (Preliminary), February 2021 U.S. airlines carried 10% more cargo by weight in February 2021 (preliminary) than in February 2020. The rise was fueled by gains of 5% in domestic cargo and 24% in international cargo, according to data filed by 15 of the leading cargo airlines. The 15 airlines carry 95% of the total cargo by weight on U.S. airlines. Cargo data consists of freight and mail carried within the U.S. and between the U.S. and foreign points.
BTS Contact:
| ||||||||||||||||||
BTS 2-Week Outlook: Bureau of Transportation Statistics Upcoming Releases April 28 - May 7






Subscribe to:
Post Comments (Atom)
No comments:
Post a Comment