BTS 2-Week Outlook Bureau of Transportation Statistics Upcoming Releases Sept 28-Oct 9 Upcoming from Sept 28 Wednesday, October 7, 2020 - 11:00am ET Airline Fuel Cost and Consumption, August 2020
Thursday, October 8, 2020 - 11:00am ET Airline Full-Time/Part-Time Employment, August 2020
Previously Released
September 14 - Airline Financial Data, 2nd Quarter 2020 September 15 - Passenger Airline Employment, July 2020 September 17 – International Air Cargo, July 2020 (Preliminary) September 18 - Airline On-Time/Cancellation Data, June 2020 September 23 - North American Freight Data, July 2020 September 24 - Rail Tank Car Safety Report, 2020
The Bureau of Transportation Statistics will release the following data sets in the next two weeks:
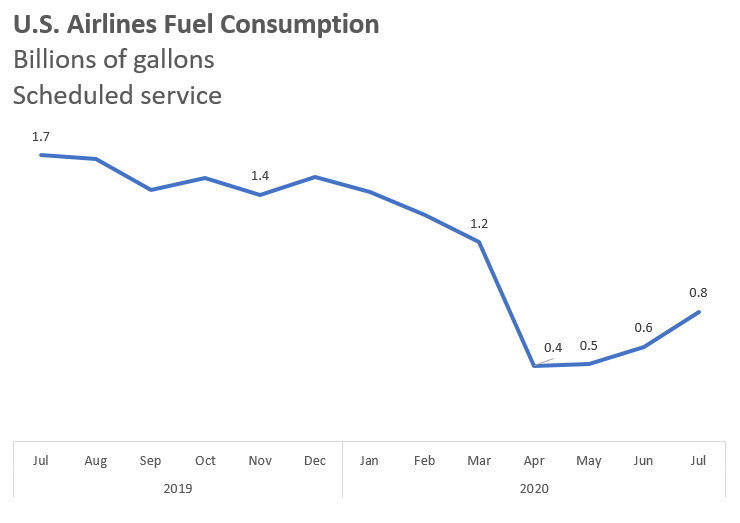
Wednesday, October 7, 2020 - 11:00am ET Previous release: U.S. airlines July 2020 fuel consumption was 37% higher than June 2020, 68% higher than May 2020 and 71% higher than April 2020. April was the lowest monthly fuel usage on record (447M gallons), dating back to 2000. July 2020 fuel consumption was down 54% from July 2019. Fuel consumed by U.S. airlines' scheduled services: July 2019 1.7 billion gallons June 2020 558 million gallons July 2020 763 million gallons Industry summary of airline fuel consumption, total fuel cost and price paid per gallon are available on the database. Individual airline numbers through June are available on the BTS website. Individual airline numbers for July and August will be available on Dec. 7.
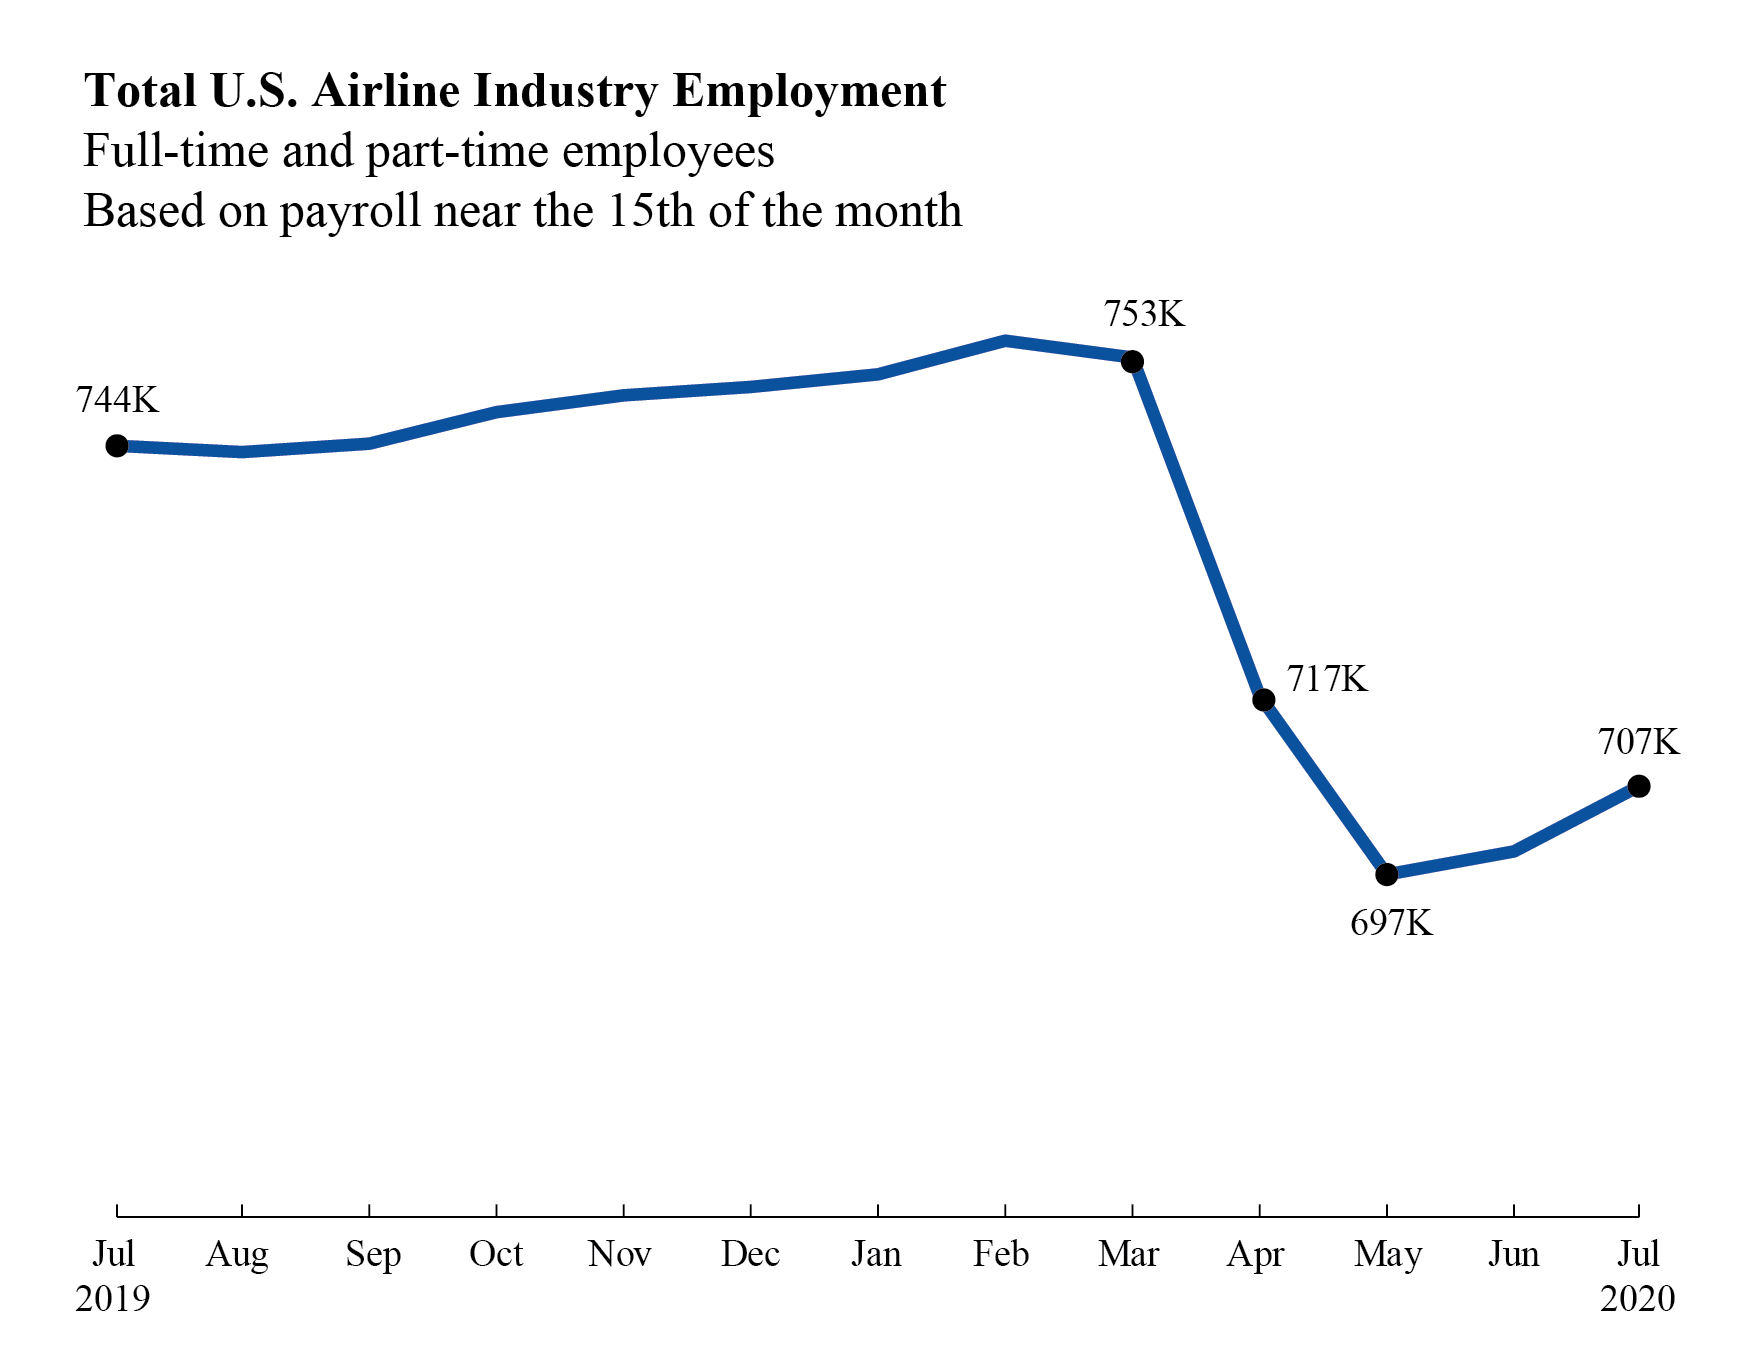
Thursday, October 8, 2020 - 11:00am ET Previous release: US airlines employed 706,824 workers in the middle of July 2020, 7,101 more than in mid-June 2020 and 46,461 fewer than in March 2020. The July 2020 numbers consist of 597,982 full-time and 108,842 part-time workers. Regulations require airlines to report employment numbers for a pay period near the 15th of the month. Monthly full-time and part-time employment statistics are reported by U.S. airlines that operate at least one aircraft that has more than 60 seats or the capacity to carry a payload of passengers, cargo and fuel weighing more than 18,000 pounds.
BTS Previously
BTS has released the following:
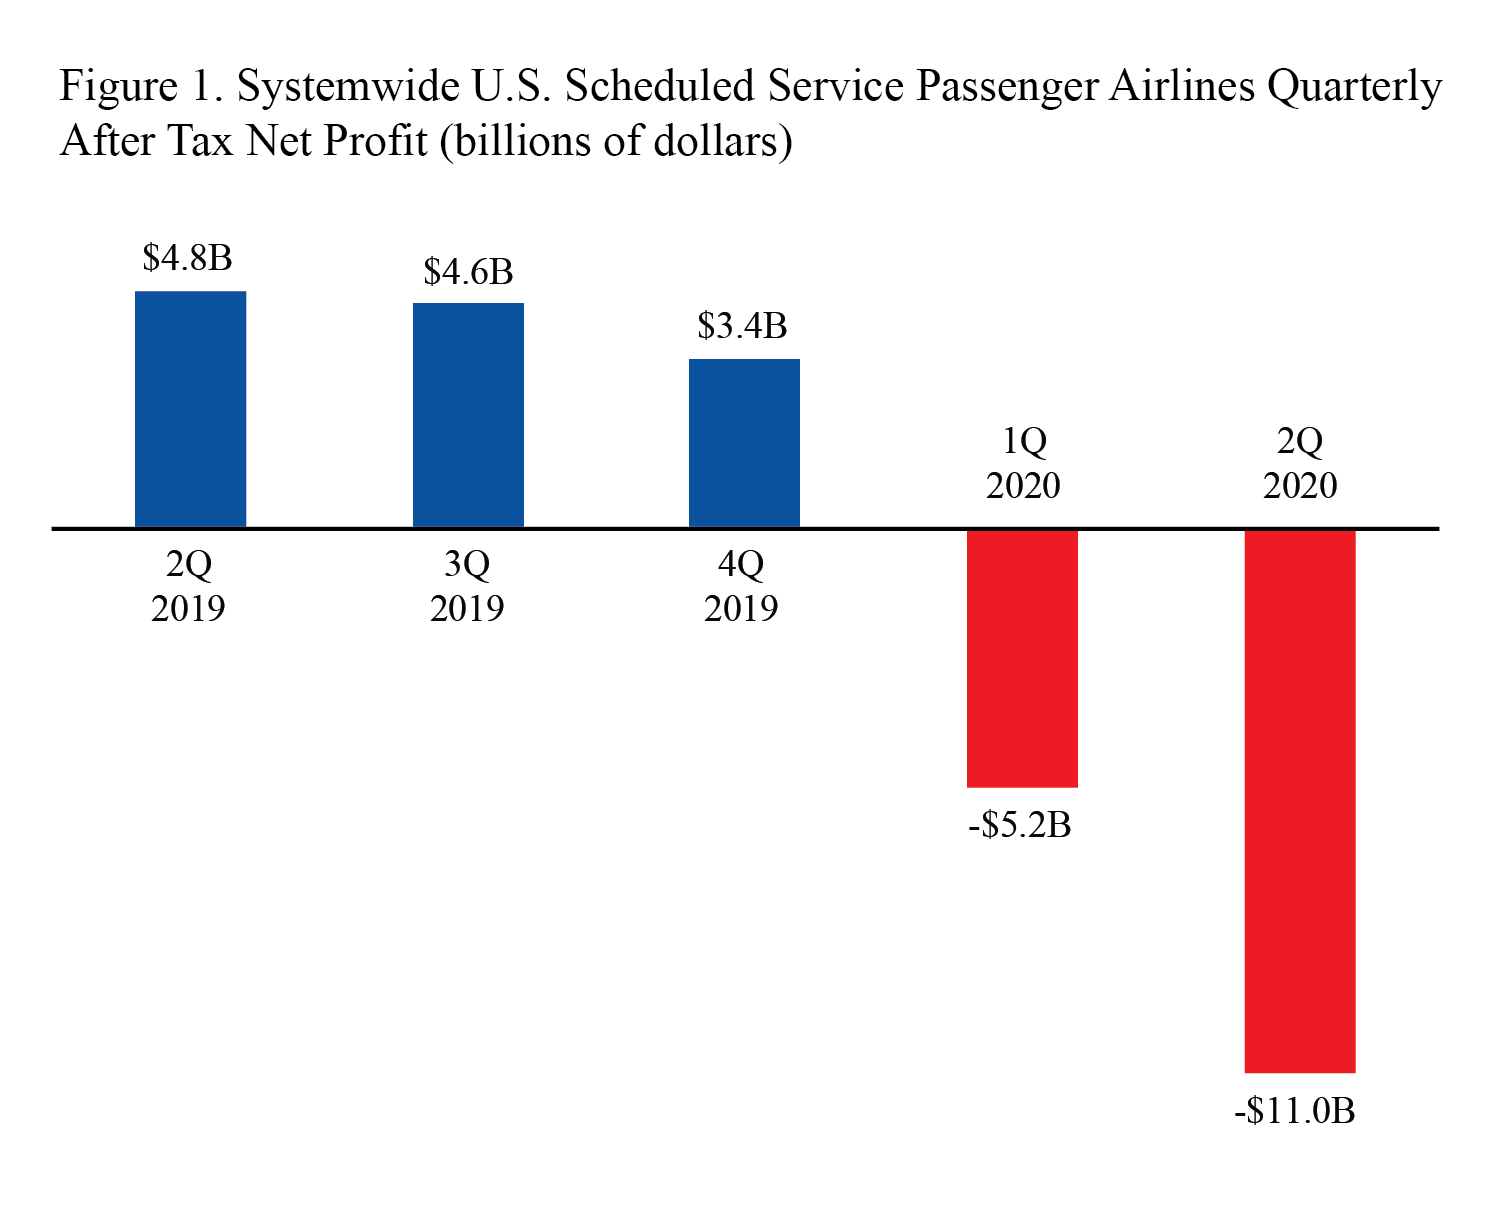
Released September 14 U.S. scheduled passenger airlines reported a second-quarter 2020 after-tax net loss of $11.0 billion and a pre-tax operating loss of $16.2 billion. These second-quarter losses are the second consecutive quarterly losses following 27 consecutive quarterly after-tax net profits and 35 consecutive quarterly pre-tax operating profits. Additional financial numbers for all airlines are available on the BTS financial databases.
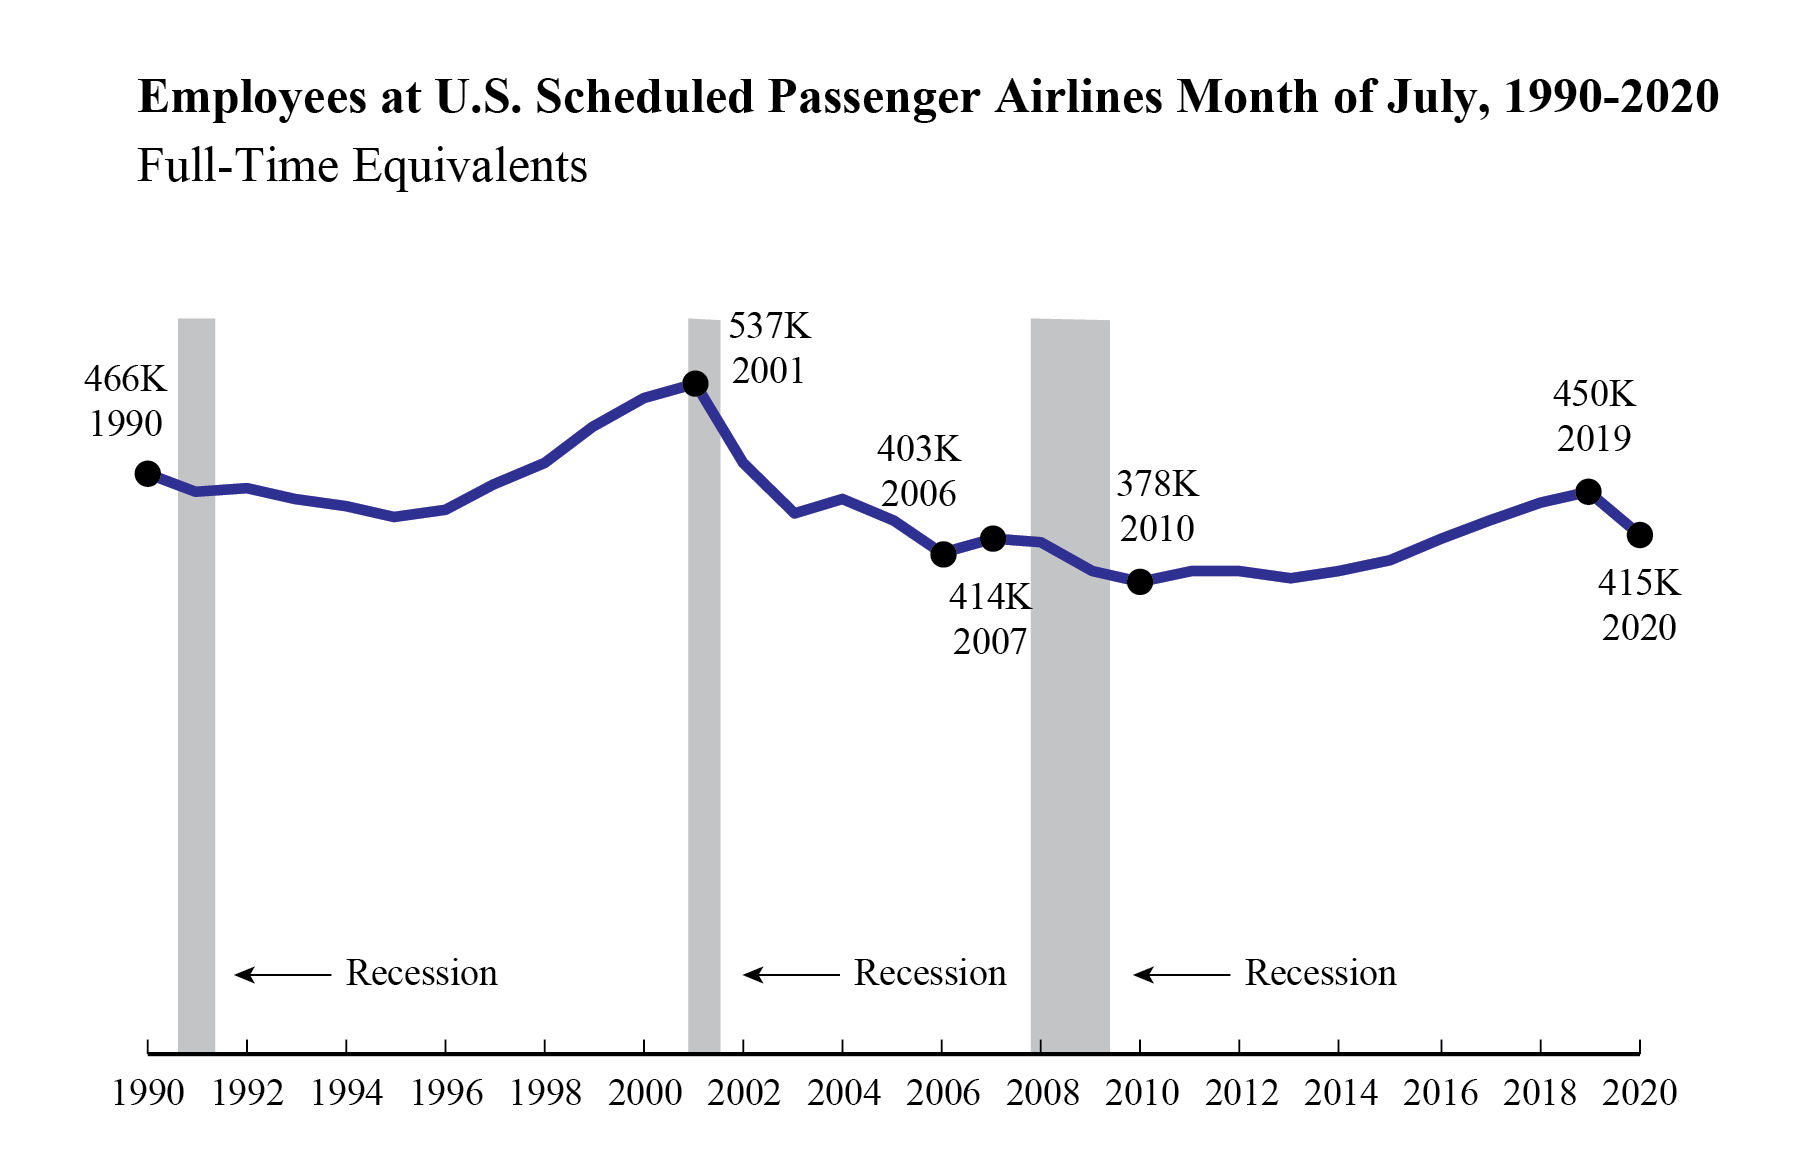
Released September 15 BTS reported that 23 U.S. scheduled passenger airlines employed 1.1% more full-time equivalents (FTEs) in mid-July 2020 than in mid-June 2020.
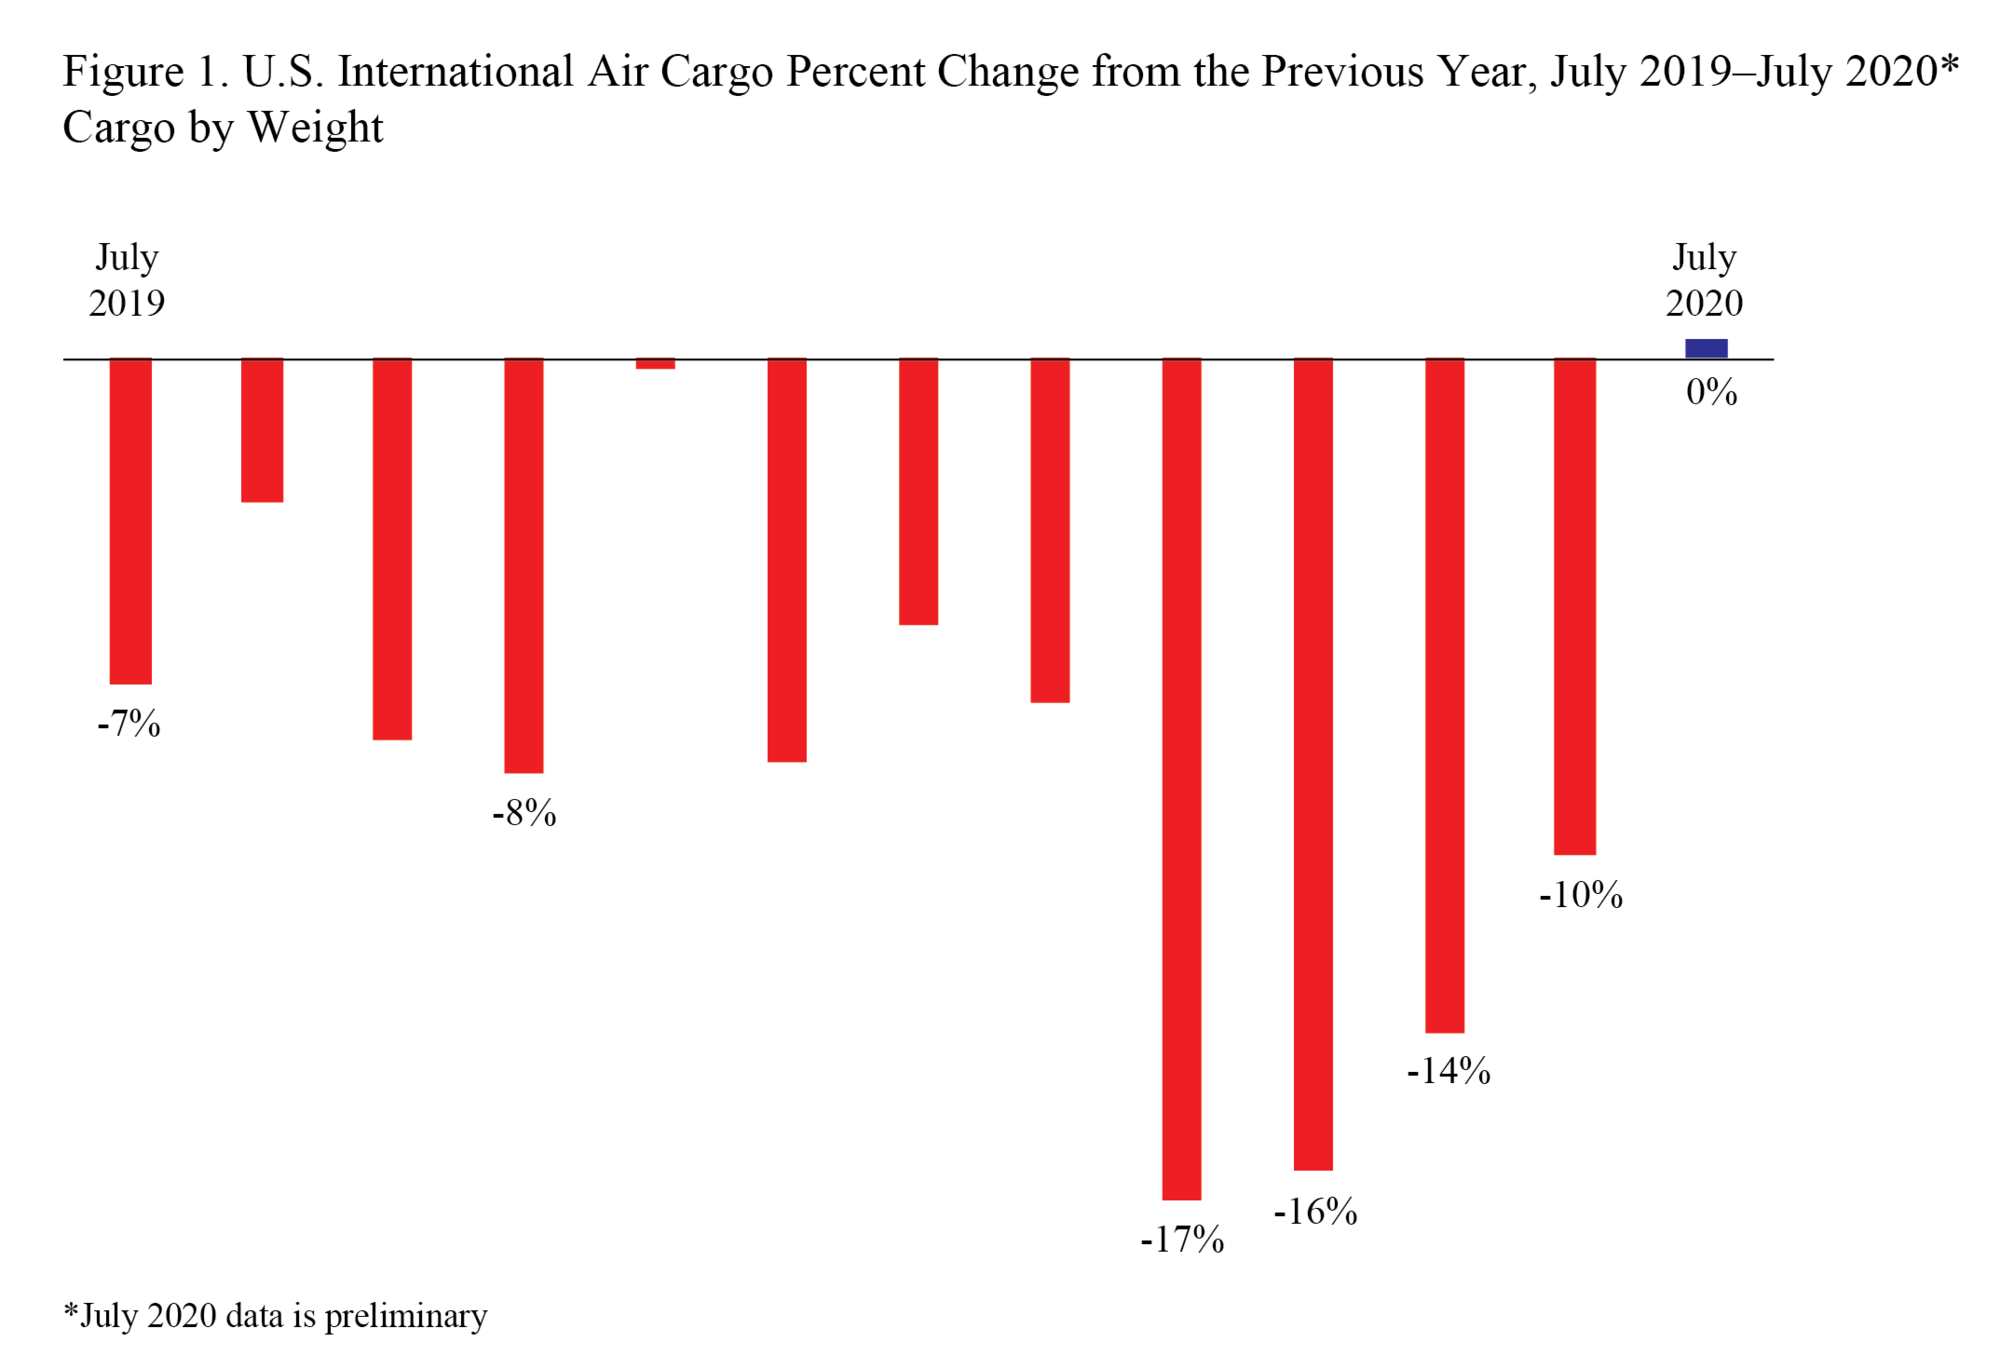
Released September 17 U.S. and foreign airlines carried 0.4% more cargo by weight between the U.S. and foreign points in July 2020 than in July 2019, including a 19% rise in cargo between the U.S. and Asia. July's 0.4% increase followed year-over-year decreases in March (down 17%), April (down 16%), May (down 14%) and June (down 10%).
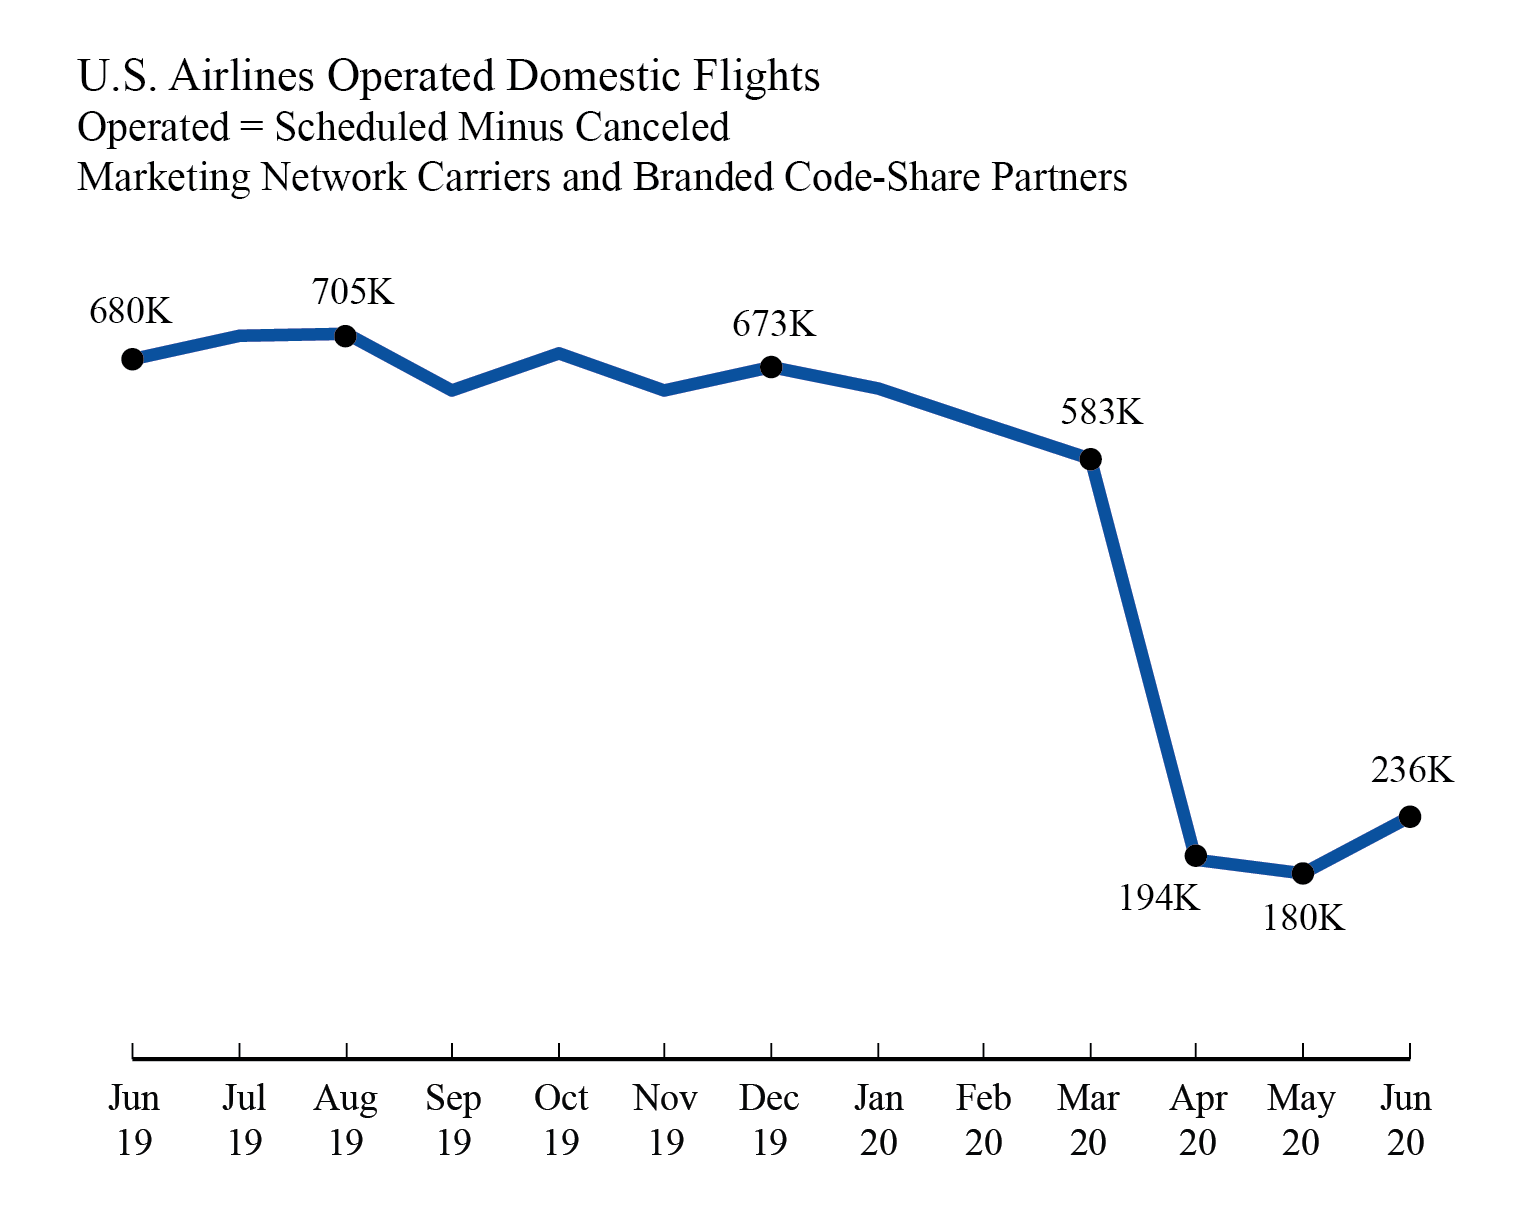
Released September 18 The 10 marketing network carriers reported 237,264 scheduled domestic flights in June 2020 compared to 192,412 flights in May 2020 and 694,469 flights in June 2019. Of those 237,264 scheduled flights, 0.43%, 1,030 flights, were canceled. As a result of schedule reductions and cancellations, the carriers reported operating 236,234 flights in June 2020, compared to the all-time monthly low of 180,151 flights in May 2020 and 194,390 flights in April 2020. The marketing carriers include branded code-share partners of mainline carriers.
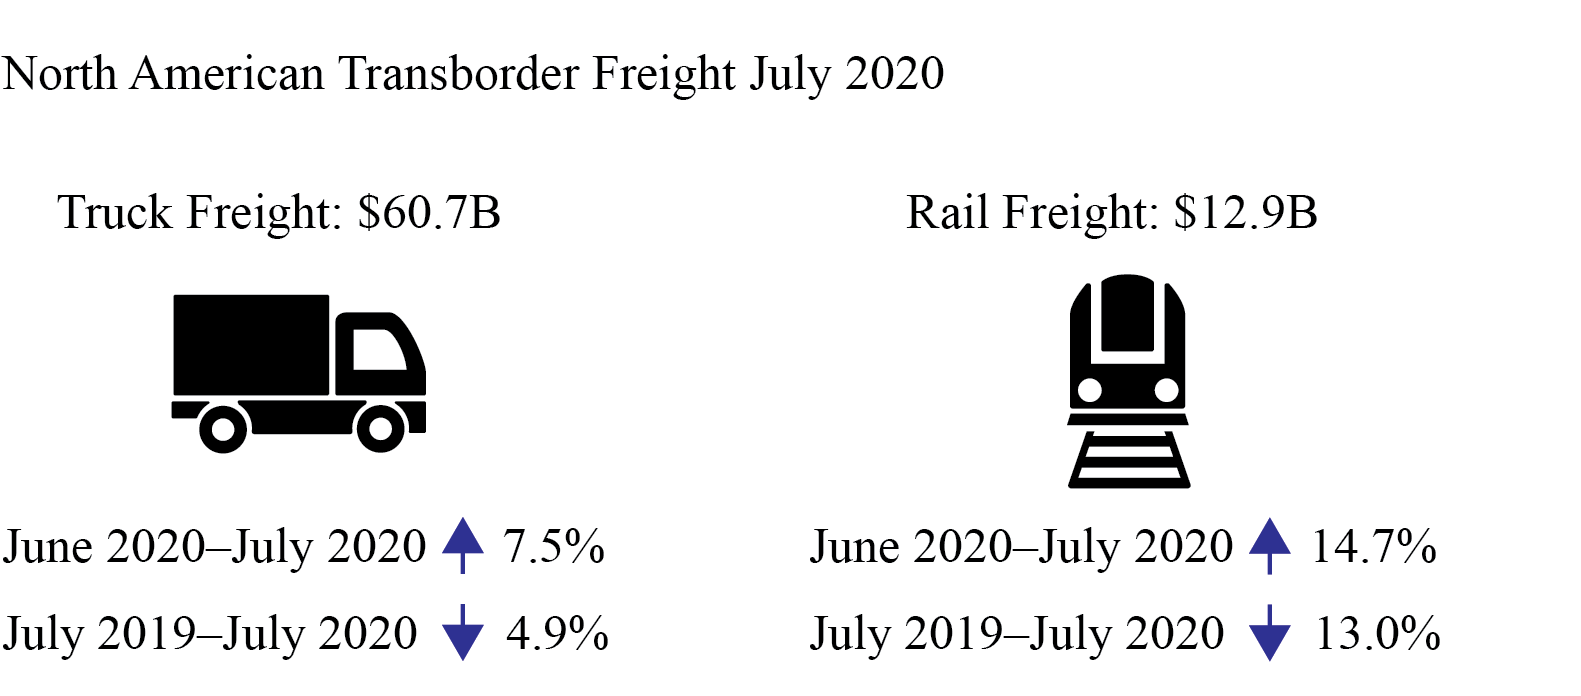
Released September 23 Freight between the U.S. and other North American countries (Canada and Mexico) in July 2020:
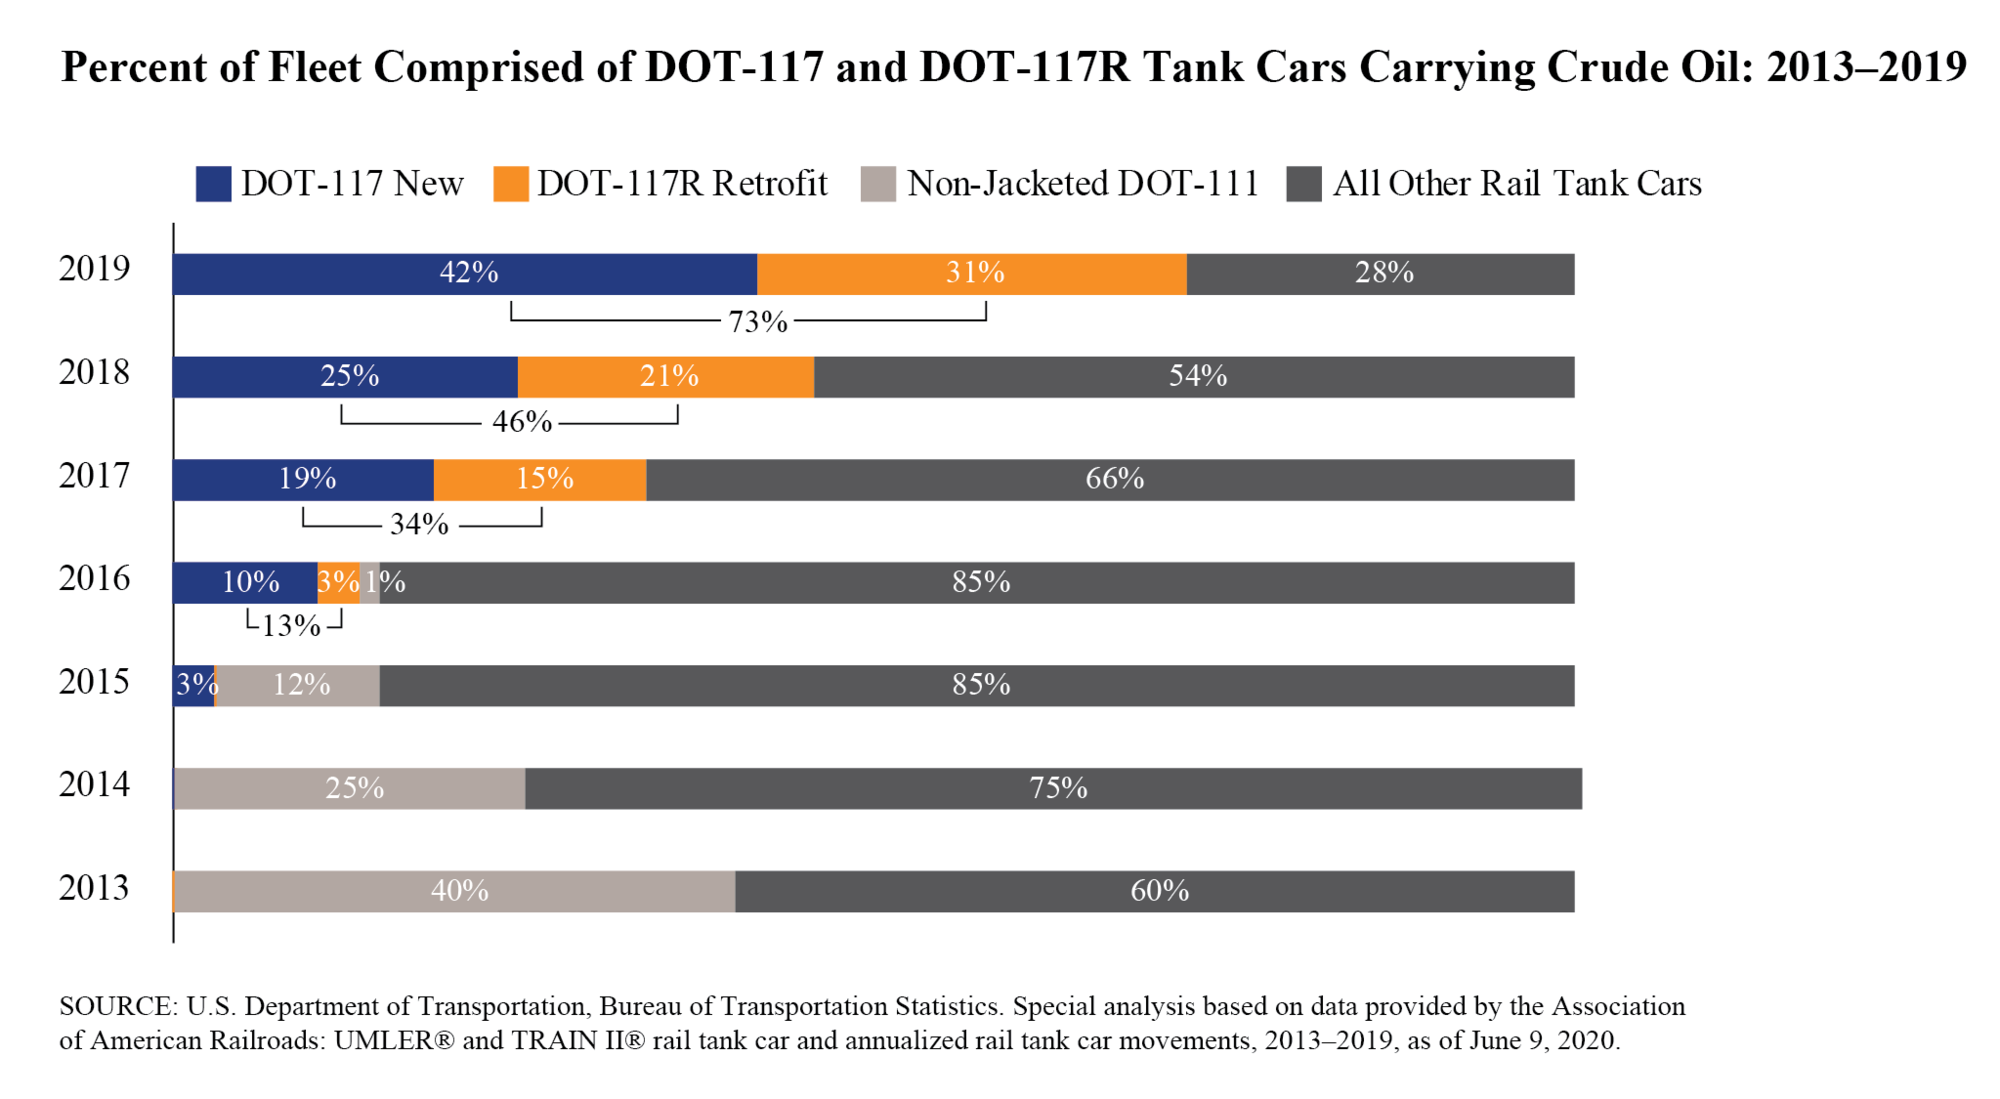
Released September 24 Nearly half, 48%, of rail tank cars carrying Class 3 flammable liquids in 2019 met the new safety requirements, up from 33% in 2018, according to Fleet Composition of Rail Tank Cars Carrying Flammable Liquids: 2020 Report. The report, measuring industry-wide progress in manufacturing and modifying rail tank cars that transport flammable liquids, has been submitted to Congress. This report tracks the transformation of the fleet carrying class 3 flammable liquids to be a fleet of DOT-117s, which meet new safety requirements. Currently some class 3 flammable liquids are carried in rail tank cars, such as DOT-111s, which have fewer safety features.
BTS Contact: Dave Smallen 202-366-5568
| ||||||||||||||||||
BTS 2-Week Outlook: Bureau of Transportation Statistics Upcoming Releases Sept 28-Oct 9


Subscribe to:
Post Comments (Atom)
No comments:
Post a Comment