| BTS 2-Week Outlook Bureau of Transportation Statistics Upcoming Releases for September 2-11,
Previous Releases for August 17-27 Upcoming Releases (September 2-11) - Thursday, September 2, 2021 - 11:00am ET
Airline Fuel Cost and Consumption, July 2021
- Wednesday, September 8, 2021 - 11:00am ET
Airline Industry Full-Time/Part-Time Employment, July 2021
- Thursday, September 9, 2021 - 10:00am ET
Freight Transportation Services Index, July 2021
Previously Released (August 17-27) - August 24– North American TransBorder Freight Data, June 2021
- August 20– Air Traffic Consumer Report, June 2021
- August 17– U.S. Airline Traffic Data (PRELIMINARY), June 2021
BTS Releases in the Next Two Weeks U.S. Air Lines Fuel Cost and Consumption July 2021
Thursday, September 2- 11:00 am ET Previous release: U.S. airlines used 8.1% more fuel (1.2 billion gallons) in June 2021 than in May 2021 (1.1 billion gallons) to reach the highest monthly consumption level since February 2020 (1.3 billion gallons). June 2021 fuel consumption was more than double that of June 2020 (558 million gallons) but still 23.8% lower than in pre-pandemic June 2019 (1.6 billion gallons). The cost per gallon rose 2.0% to $2.02 per gallon in June from $1.98 in May. Previous Release
Data 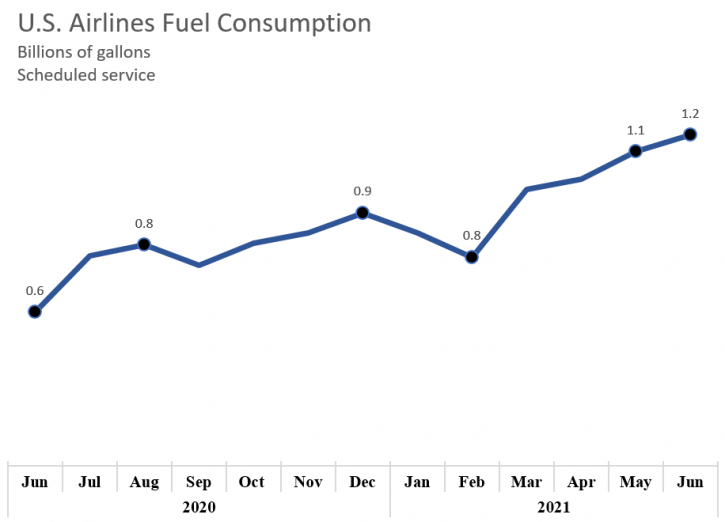
U.S. Air Lines Industry Employment, July 2021
Wednesday, September 8- 11:00 am ET Previous release: U.S. airlines employed 709,678 workers in June 2021, 48 more than in May 2021 (709,630) and 39,349 fewer than in March 2020 (749,027). The June industry numbers consist of 599,050 full-time and 110,628 part-time workers. Previous Release
Data 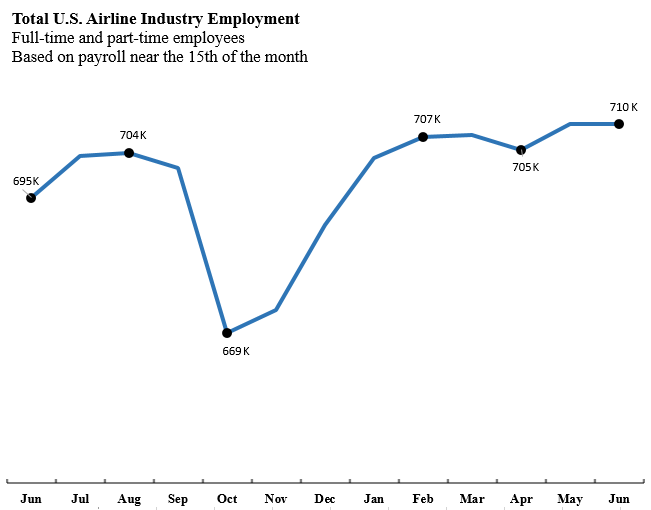 Freight Transportation Services Index, July2021
Thursday, September 9- 10:00 am ET Previous release: The Freight Transportation Services Index (TSI), which is based on the amount of freight carried by the for-hire transportation industry, fell 0.2% in June from May, falling for the second consecutive month. From June 2020 to June 2021 the index rose 5.6% compared to a decline of 7.0% from June 2019 to June 2020 and an increase of 1.4 percent from June 2018 to June 2019. Previous Release
Data 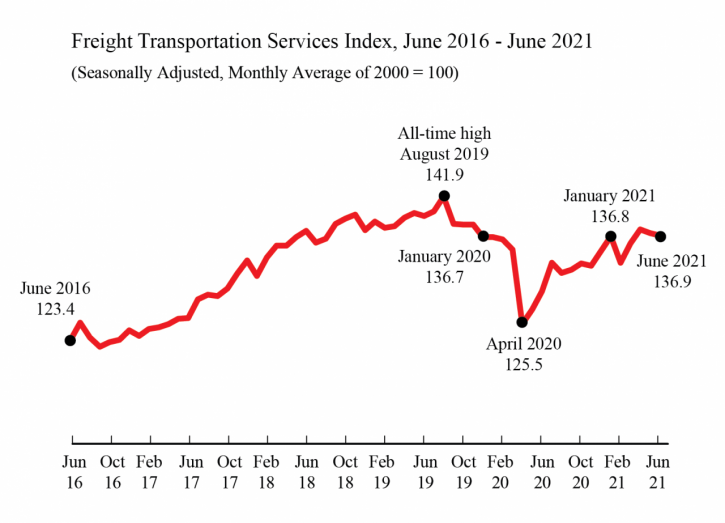
BTS Previous Releases U.S. Airline Traffic Data (PRELIMINARY), June 2021
Tuesday, August 17 U.S. airlines carried 304% more scheduled service passengers in June 2021 than in June 2020 (preliminary). The airlines carried 21% fewer total passengers, 17% fewer domestic passengers and 45% fewer international passengers than in pre-pandemic June 2019. The airlines carried 21% more passengers in June 2021 than in May 2021 (55M). Release
Data 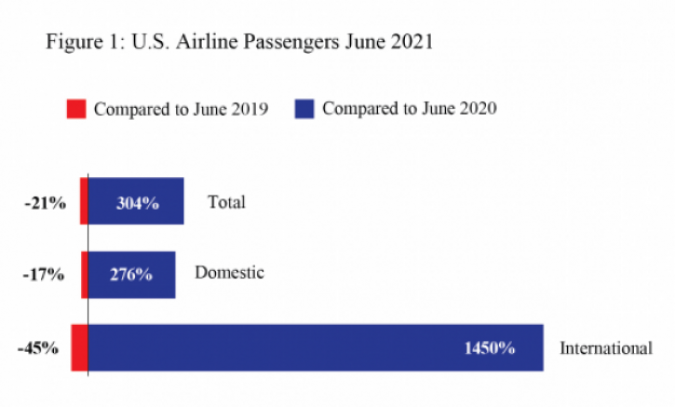 Air Traffic Consumer Report, June 2021
Friday, August 20, 2021 The total number of flights operated in June 2021 has reached 83% of pre-pandemic levels with 564,583 flights operated in June 2021 compared with 679,802 flights operated in June 2019. Flights operated in June 2021 were more than double the 236,234 flights operated in June 2020. In June 2021, the 10 marketing network carriers reported 573,779 scheduled domestic flights, 9,196 (1.6%) of which were canceled. In June 2020, the same airlines reported 237,234 scheduled domestic flights, 1,030 (0.4%) of which were canceled. In pre-pandemic June 2019, airlines reported 694,469 scheduled domestic flights, 14,667 (2.1%) of which were canceled. Release
Data 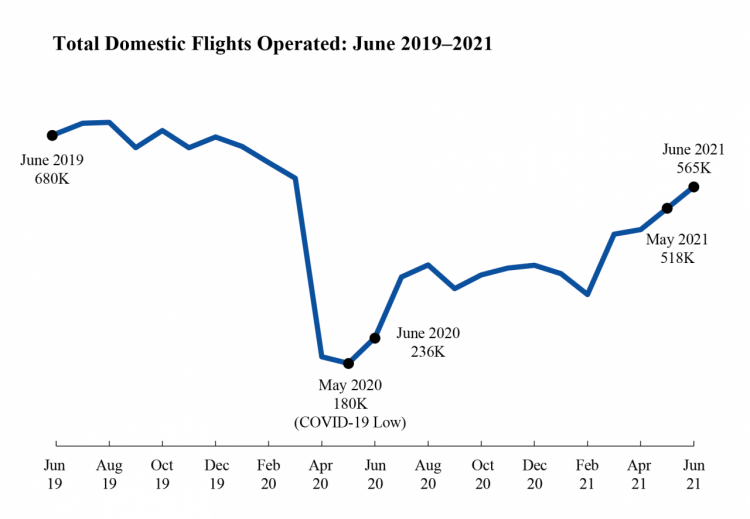
North American TransBorder Freight Data, June 2021
Tuesday, August 24, 2021 The total value of transborder freight moved by all modes of transportation in June 2021 was $116 billion, up 41% compared to June 2020. June 2021 transborder freight was up 11.8% compared to $103.8 billion in pre-pandemic June 2019. Freight between the U.S. and Canada totaled $58.8B, and freight between the U.S. and Mexico totaled $57.2B. The most-used mode was trucking with trucks moving $72.2 billion of freight, up 27.9% compared to June 2020 and up 10% compared to $65.6 billion in June 2019. 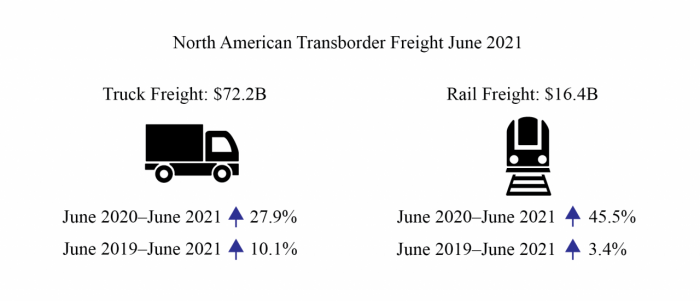
| U.S. Department of Transportation | 1200 New Jersey Avenue, SE | Washington DC 20590 | 855-368-4200 |  | |


No comments:
Post a Comment