| BTS 39-21
Monday, June 14, 2021
BTS Contact: Dave Smallen
david.smallen@dot.gov
U.S. Airlines Narrow Net Loss in 1st Quarter 2021 from 4th Quarter 2020 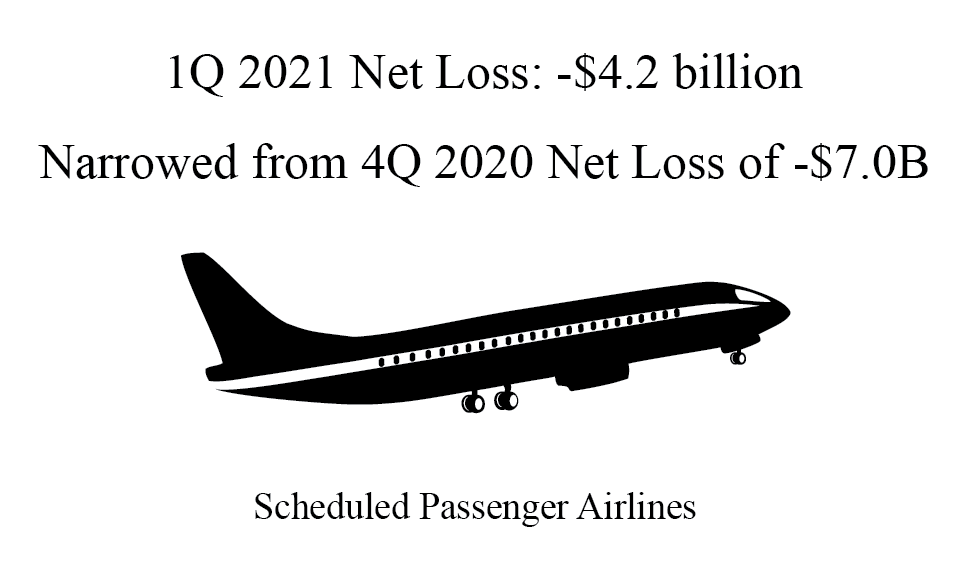 U.S. scheduled passenger airlines reported a first-quarter 2021 after-tax net loss of $4.2 billion and a pre-tax operating loss of $12.7 billion. While these first-quarter losses are the fifth consecutive quarterly losses, the extent of the losses is narrowing. The airlines reduced their losses in the first quarter from the fourth quarter of 2020. The first-quarter after-tax net loss of $4.2 billion was reduced from the fourth-quarter loss of $7.0 billion. The first-quarter pre-tax operating loss of $12.7 billion was increased from the fourth-quarter loss of $9.7 billion. U.S. airline financial reports are filed quarterly with the Bureau of Transportation Statistics (BTS). See the tables that accompany this release on the BTS website for additional first-quarter 2021 financial results (Tables 1-6). Payroll protection payments received by airlines are included as net income. Payroll protection payments used for salaries are included as labor expenses.
Systemwide operations, includes 24 U.S. airlines:
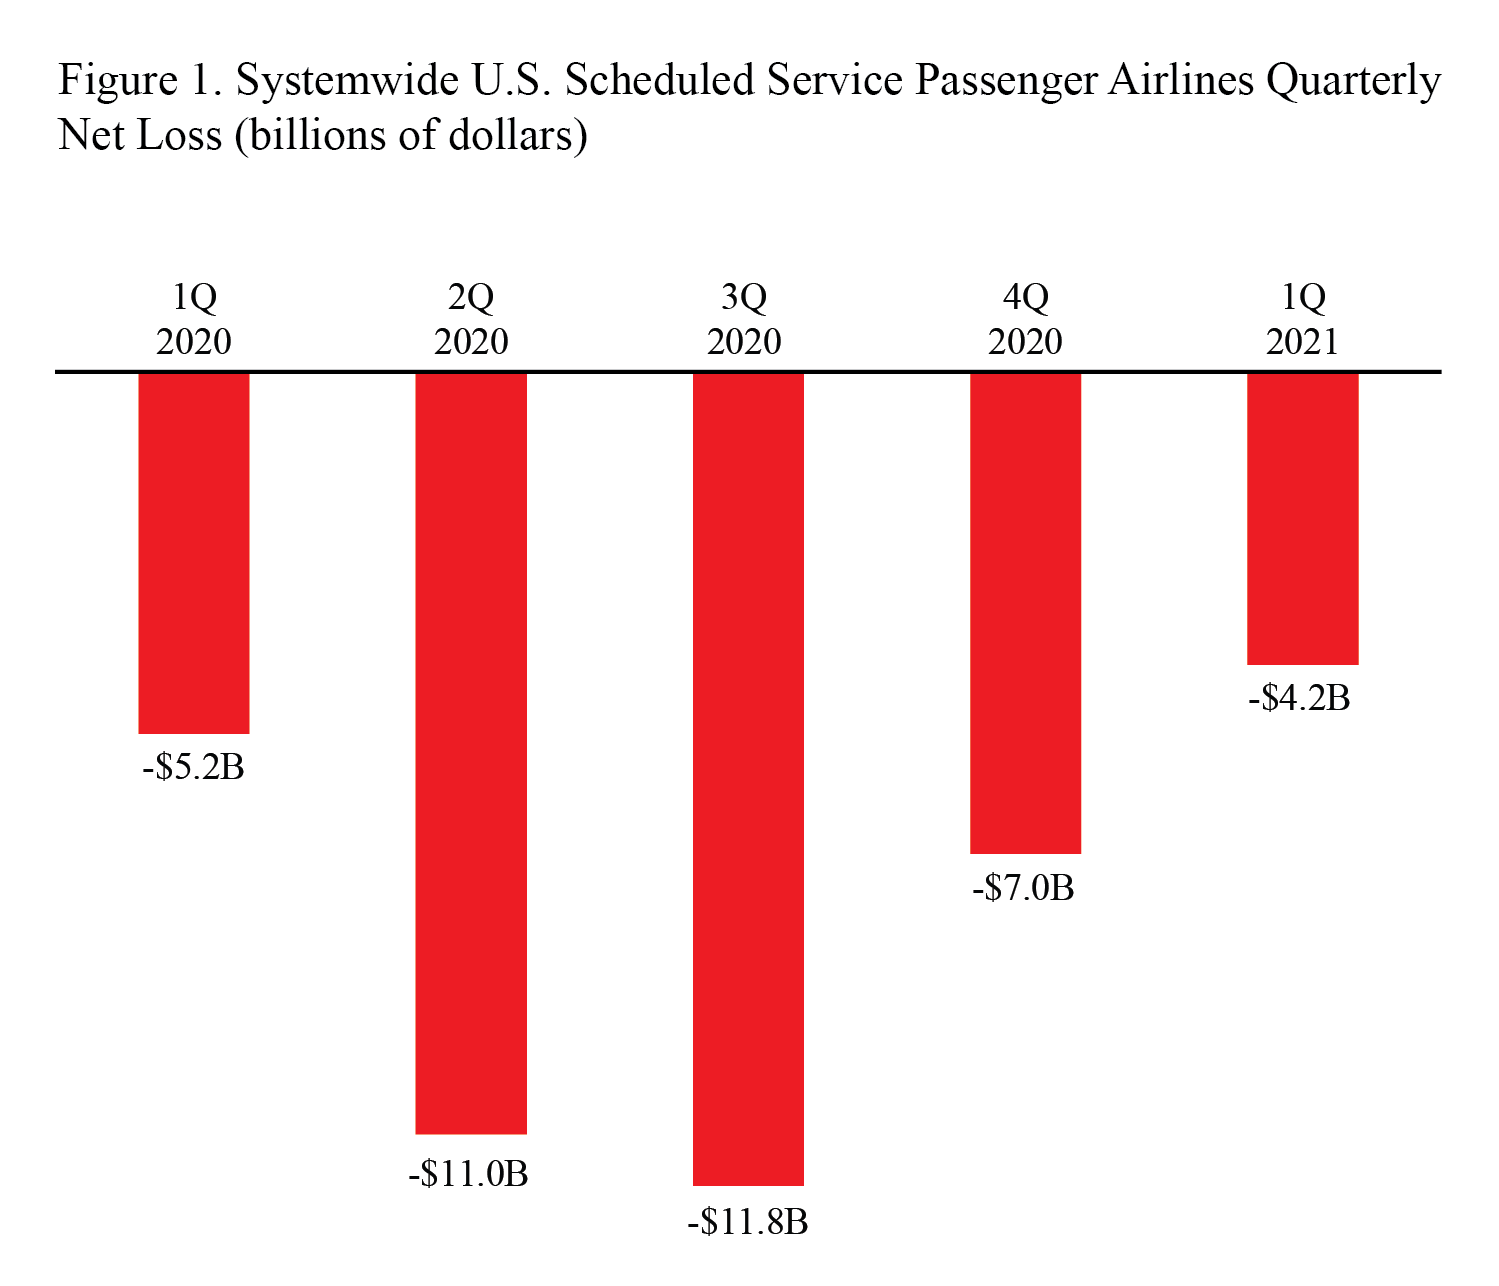
After-tax net profit/loss net income • $4.2 billion loss in 1Q 2021
• Compared to $7.0 billion loss in 4Q 2020
• Compared to $5.2 billion loss in 1Q 2020 Pre-tax operating profit/loss • $12.7 billion loss in 1Q 2021
• Compared to $9.7 loss in 4Q 2020
• Compared to $4.6 billion loss in 1Q 2020 • Total 1Q 2021 operating revenue: $17.9 billion
Share of total 1Q 2021 operating revenue: o Fares: $10.6 billion, 59.2%, compared to 71.8% in 1Q 2020
o Baggage fees: $834.3 million, 4.7%, compared to 3.3% in 1Q 2020
o Reservation change fees: $101.9 million, 0.6%, compared to 1.8% in 1Q 2020 Fees are included for calculations of net income, operating revenue and operating profit or loss. • Total 1Q 2021 operating expenses: $30.5 billion:
Share of total 1Q 2021 operating expenses: o Fuel: $3.5 billion, 11.6%, compared to 15.2% in 1Q 2020
o Labor: $11.4 billion, 37.5%, compared to 34.5% in 1Q 2020 Domestic operations, includes 24 U.S. airlines: 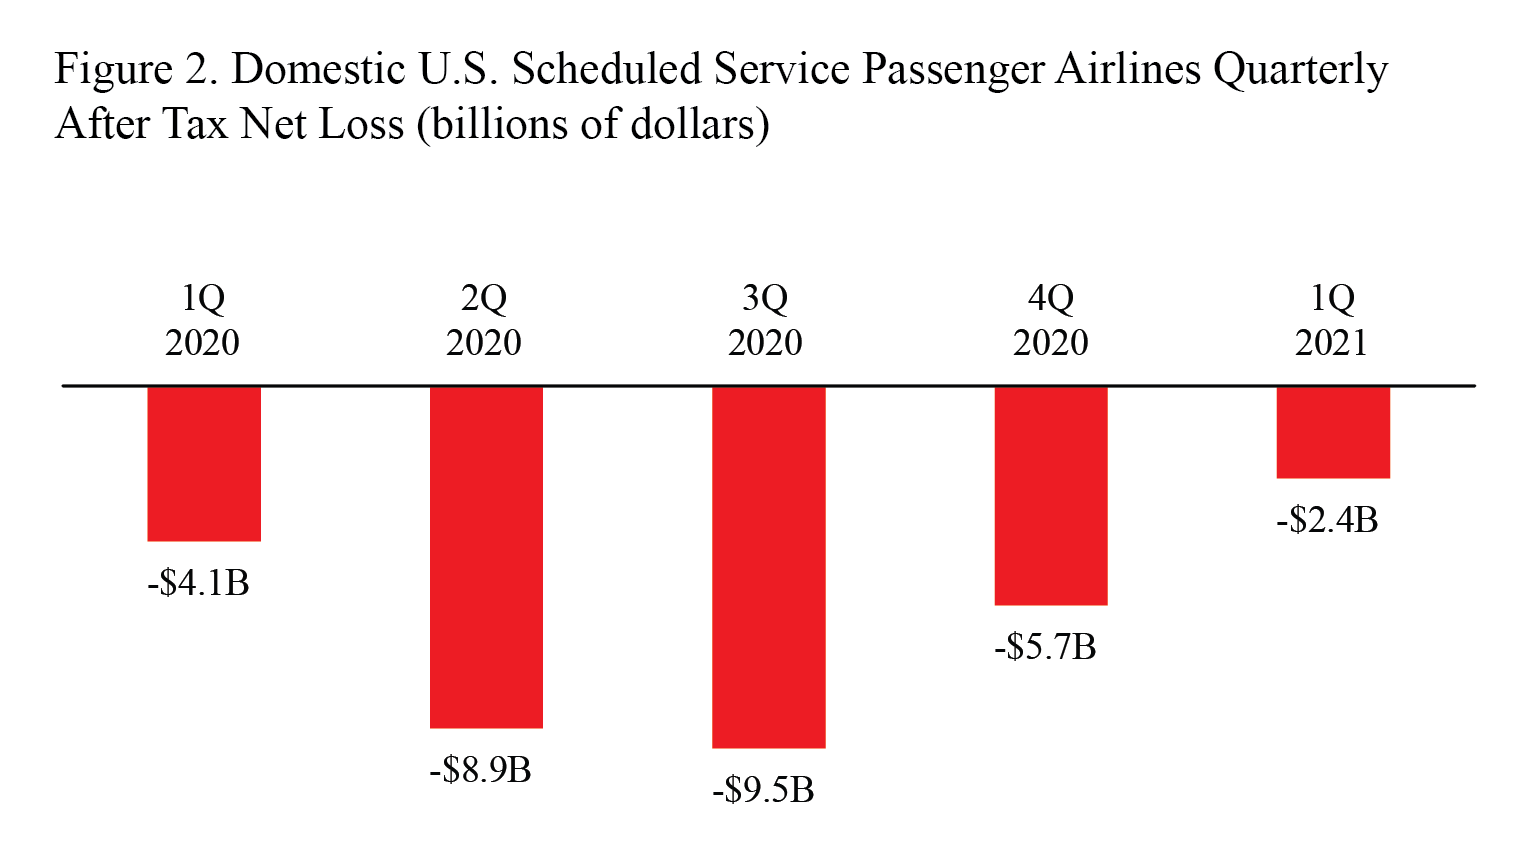
After-tax domestic net profit/loss (net income) • $2.4 billion loss in 1Q 2021
• Compared to $5.7 billion loss in 4Q 2020
• Compared to $4.1 billion loss in 1Q 2020 Pre-tax domestic operating profit/loss • $9.6 billion loss in 1Q 2021
• Compared to $8.0 billion loss in 4Q 2020
• Compared to $3.8 billion loss in 1Q 2020 • 1Q 2021 domestic operating revenue: $14.7 billion
Share of total 1Q 2021 domestic operating revenue: o Fares: $8.9 billion, 60.3%, compared to 69.3% in 1Q 2020
o Baggage fees: $678.2 million, 4.6%, compared to 3.4% in 1Q 2020
o Reservation change fees: $86.6 million, 0.6%, compared to 1.7% in 1Q 2020 Fees are included for calculations of net income, operating revenue and operating profit or loss. • 1Q 2021 domestic operating expenses: $24.3 billion, of which:
Share of total 1Q 2021 domestic operating expenses: o Fuel: $2.6 billion, 10.5%, compared to 14.0% in 1Q 2020
o Labor: $8.9 billion, 36.4%, compared to 33.6% in 1Q 2020 International operations, includes 18 U.S. airlines: 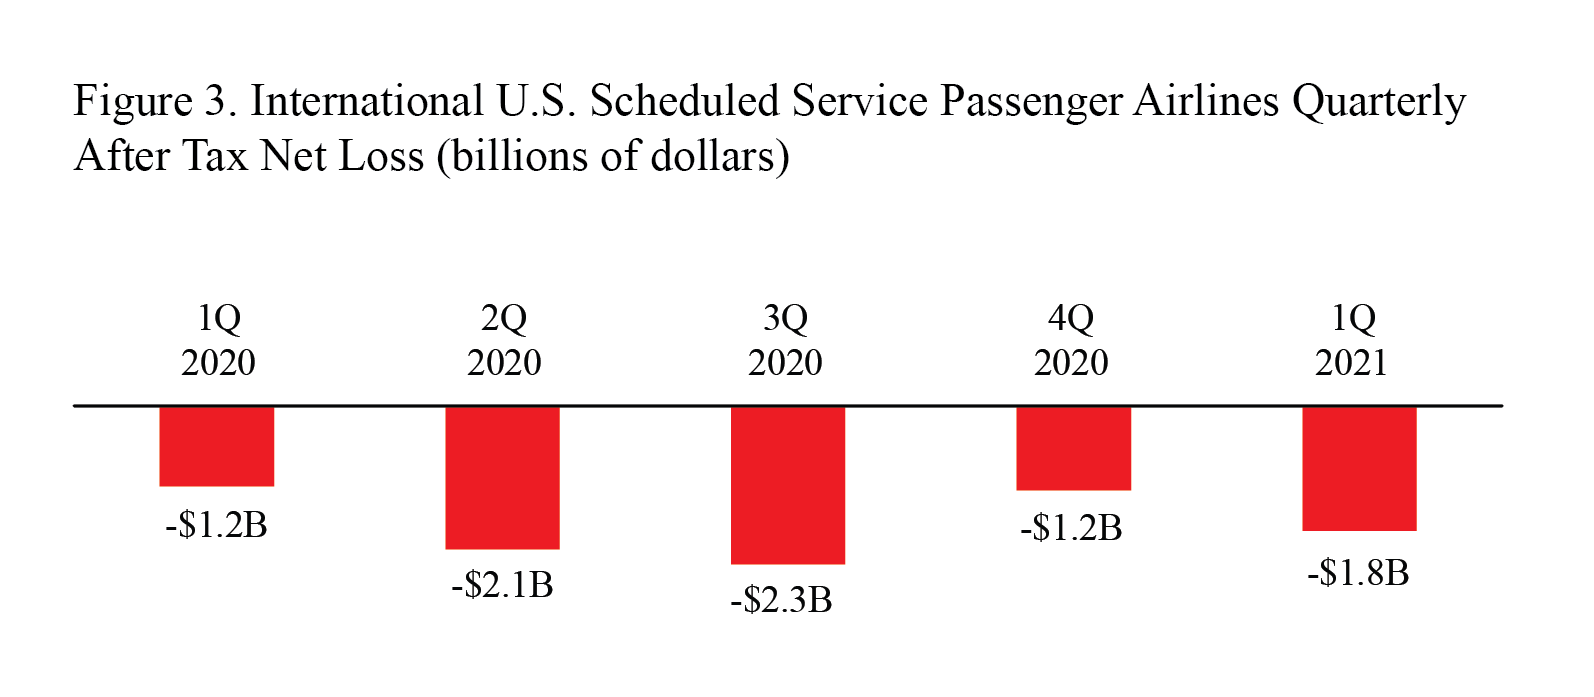
After-tax international net profit/loss (net income) • $1.8 billion loss in 1Q 2021
• Compared to $1.2 billion loss in 4Q 2020
• Compared to $1.2 billion loss in 1Q 2020 Pre-tax international operating profit/loss • $3.0 billion loss in 1Q 2021
• Compared to $1.7 billion loss in 4Q 2020
• Compared to $722 million loss in 1Q 2020 • 1Q 2021 international operating revenue: $3.2 billion, of which:
Share of 1Q 2021 international operating revenue: o Fares: $1.7 billion, 54.5%, compared to 80.1% in 1Q 2020
o Baggage fees: $156.1 million, 4.9%, compared to 2.9% in 1Q 2020
o Reservation change fees: $15.3 million, 0.5%, compared to 2.0% in 1Q 2020 Fees are included for calculations of net income, operating revenue and operating profit or loss.
• 1Q 2021 international operating expenses: $6.2 billion, of which:
Share of 1Q 2021 international operating expenses: o Fuel: $972.6 million, 15.7%, compared to 19.6% in 1Q 2020
o Labor: $2.6 billion, 41.5%, compared to 37.6% in 1Q 2020
1st Quarter Margins
Net margin is the net income or loss as a percentage of operating revenue. Operating margin is the operating profit or loss as a percentage of operating revenue.
Systemwide:
Net income margin:
• -23.8% in 1Q2021
• Compared to -14.0% in 1Q2020 Operating margin: • -70.9% in 1Q2021
• Compared to -12.2% in 1Q2020 Domestic
Net income margin: • -16.4% in 1Q2021
• Compared to -14.1% in 1Q2020 Operating margin: • -65.7% in 1Q2021
• Compared to -13.3% in 1Q2020 International
Net income margin: • -57.7% in 1Q2021
• Compared to -13.8% in 1Q2020 Operating margin: • -95.0% in 1Q2021
• Compared to -8.5% in 1Q2020 Reporting notes
Additional data: BTS website, see tables for operating profit/loss, operating revenue and fuel cost and consumption. See the BTS financial databases for more detailed data including numbers for individual airlines. Filing requirement: By regulation, for the quarter ending March 31, airlines that operate at least one aircraft that is designed/certified for more than 60 seats or the capacity to carry a payload of passengers and cargo weighing more than 18,000 pounds must report financial data to BTS by May 10. The airline filings are subject to a process of quality assurance and data validations before release to the public. Data updates: Revised carrier data and late data filings will be made available monthly on TranStats on the Monday following the second Tuesday of the month. All data are subject to revision. BTS will release second-quarter 2021 data on Sept. 13.
| U.S. Department of Transportation | 1200 New Jersey Avenue, SE | Washington DC 20590 | 202-385-HELP (4357) |  | | 

No comments:
Post a Comment