November 2019 North American Transborder Freight Numbers

Transportation.Gov web banner

Having trouble viewing this email? View it as a Web page.

Bookmark and Share


BTS 05-20
Tuesday, January 28, 2020
BTS Contact: Dave Smallen
Tel:  202-366-5568


November 2019 North American Transborder Freight Numbers


Transborder freight between the U.S. and other North American countries (Canada and Mexico) in November 2019:

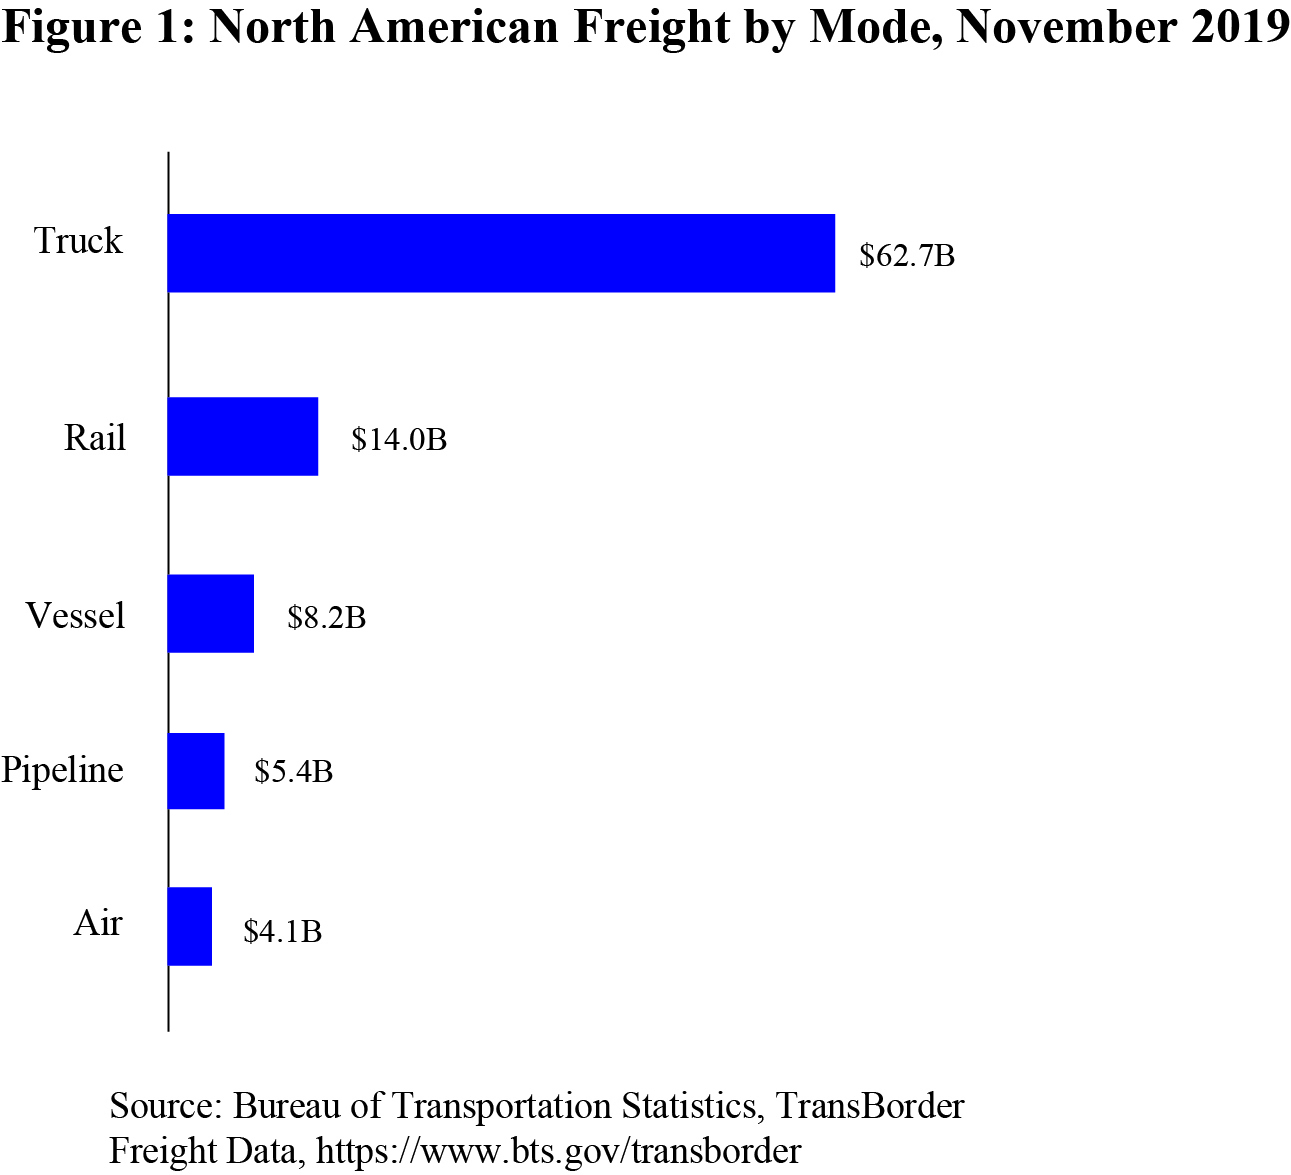
  • Total Transborder Freight: $99.0 billion of transborder freight moved by all modes of transportation, down 3.9% compared to November 2018
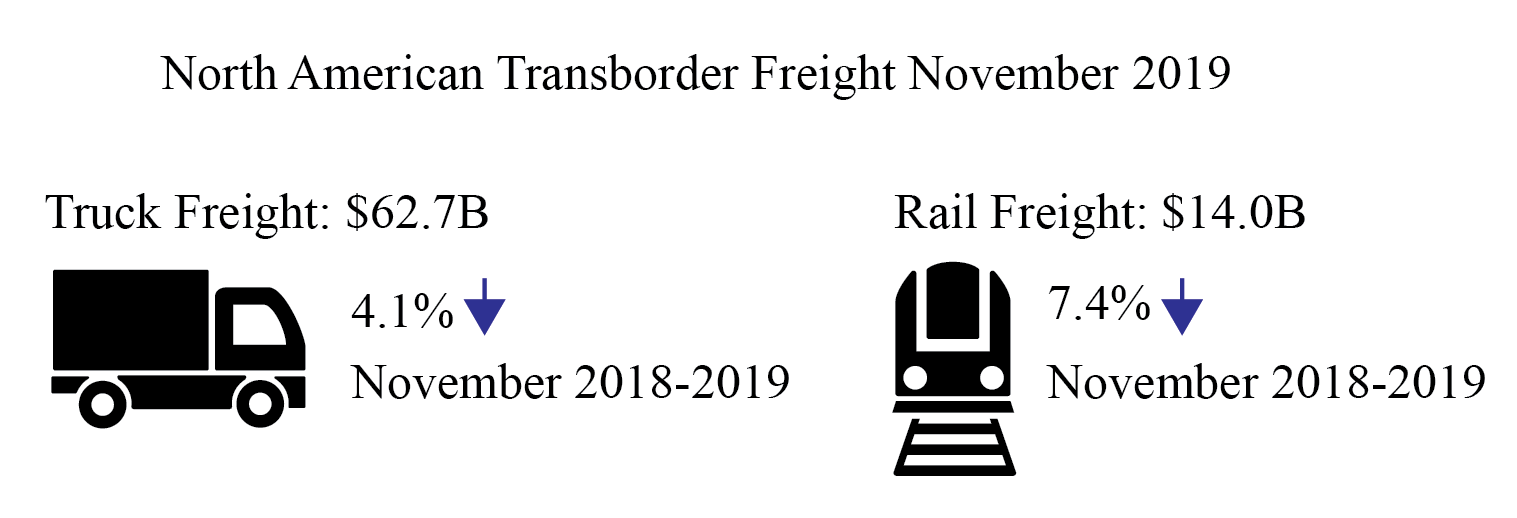
  • Most-used mode: Trucks moved $62.7 billion of freight, down 4.1% compared to November 2018
  • Second most-used mode: Railways moved $14.0 billion of freight, down 7.4% compared to November 2018


Vessel shipments rose 4.5% as vessel transport of mineral fuels rose 11.8% or $576 million in a shift from rail and pipeline. Air shipments rose 3.5%.


Transborder Nov 2019 Infographic


Truck Freight: $62.7 billion (63.3% of all transborder freight)

  • By border:

U.S.-Canada: $28.3 billion (57.8% of all northern border freight)

U.S.-Mexico: $34.4 billion (68.6% of all southern border freight)

  • Compared to November 2018:

U.S.-Canada down 1.6%

U.S.-Mexico down 6.1%


  • Three busiest truck border ports (46.1% of total transborder truck freight)
    • Laredo, TX                     $14.6    billion
    • Detroit, MI                      $8.9    billion
    • El Paso, TX                      $5.4    billion


  • Top three truck commodities (50.5% of total transborder truck freight)
    • Computers and parts              $12.2  billion
    • Electrical machinery                $10.2  billion
    • Motor vehicles and parts          $9.2  billion


Transborder Nov 2019 Fig 1


Rail Freight: $14.0 billion (14.2% of all transborder freight)

  • By border:

U.S.-Canada: $7.2 billion (14.7% of all northern border freight)

U.S.-Mexico: $ 6.9 billion (13.7% of all southern border freight)


  • Compared to November 2018:

U.S.-Canada down 13.3%, a decrease mostly due to a 19.7% decline in mineral fuels, which were partly shifted to vessel, and a 36.0% drop in plastics and articles of plastic.

U.S.-Mexico down 0.4%


  • Three busiest rail border ports (56.1% of total transborder rail freight)
    • Laredo, TX                        $3.8 billion
    • Detroit, MI                        $2.2 billion
    • Eagle Pass, TX                   $1.9 billion


  • Top three rail commodities (65.5% of total transborder rail freight)
    • Motor vehicles and parts    $7.3 billion
    • Mineral fuels                     $1.2 billion
    • Computers and parts         $0.7 billion


Total Transborder Freight by Mode:

U.S.-Canada (both directions)
(Dollars in Billions)
Truck:                $28.3
Rail:                   $7.2
Pipeline:             $4.8
Air:                    $2.8
Vessel:               $2.7


U.S.-Mexico (both directions)
(Dollars in Billions)
Truck:                $34.4
Rail:                    $6.9
Vessel:                $5.5
Air:                     $1.3
Pipeline:              $0.5


Reporting Notes

Data in this Bureau of Transportation Statistics release are not seasonally adjusted and are not adjusted for inflation. For previous statistical releases and summary tables, see TransBorder Releases. See TransBorder Freight Data for data from previous months, and for additional state, port, and commodity data. BTS has scheduled the release of December TransBorder numbers for Feb. 25.


U.S. Department of Transportation | 1200 New Jersey Avenue, SE | Washington DC 20590 | 202-385-HELP (4357) GovDelivery logo

No comments:

Post a Comment