| BTS 2-Week Outlook Bureau of Transportation Statistics Upcoming Releases June 4 through June 15 The Bureau of Transportation Statistics will release the following data sets in the next two weeks: - Airline Fuel Cost and Consumption, April 2018
Tuesday, June 5, 2018 - 11:00am ET BTS Airline Fuel Cost and Consumption database to be updated with April data. Last month, US airlines March fuel cost was $1.99 per gallon, down seven cents from February ($2.06) and up 34 cents from March 2017 ($1.65). Industry summary of airline fuel consumption, total fuel cost and price paid per gallon are available on the database. Individual airline numbers through December are available on the BTS website. Thursday, June 7, 2018 - 11:00am ET BTS Airline Employment database to be updated with April data. Last month, U.S. airlines March employment (707,086 total full-time and part-time)) was up 0.1pct from February and up 2.2pct from March 2017. Monthly full-time and part-time employment statistics reported by U.S. airlines that operate at least one aircraft that has more than 60 seats or the capacity to carry a payload of passengers, cargo and fuel weighing more than 18,000 pounds. Includes passenger and cargo airlines. - Transportation Services Index (TSI), April 2018
Wednesday, June 13, 2018 - 11:30am ET The Freight TSI measures the month-to-month changes in for-hire freight shipments by mode of transportation. The Passenger TSI measures the month-to-month changes in travel that involves the services of the for-hire passenger transportation sector. Last month, BTS reported that the Freight TSI rose 1.4 percent in March from February, rising for the second consecutive month to reach an all-time high. 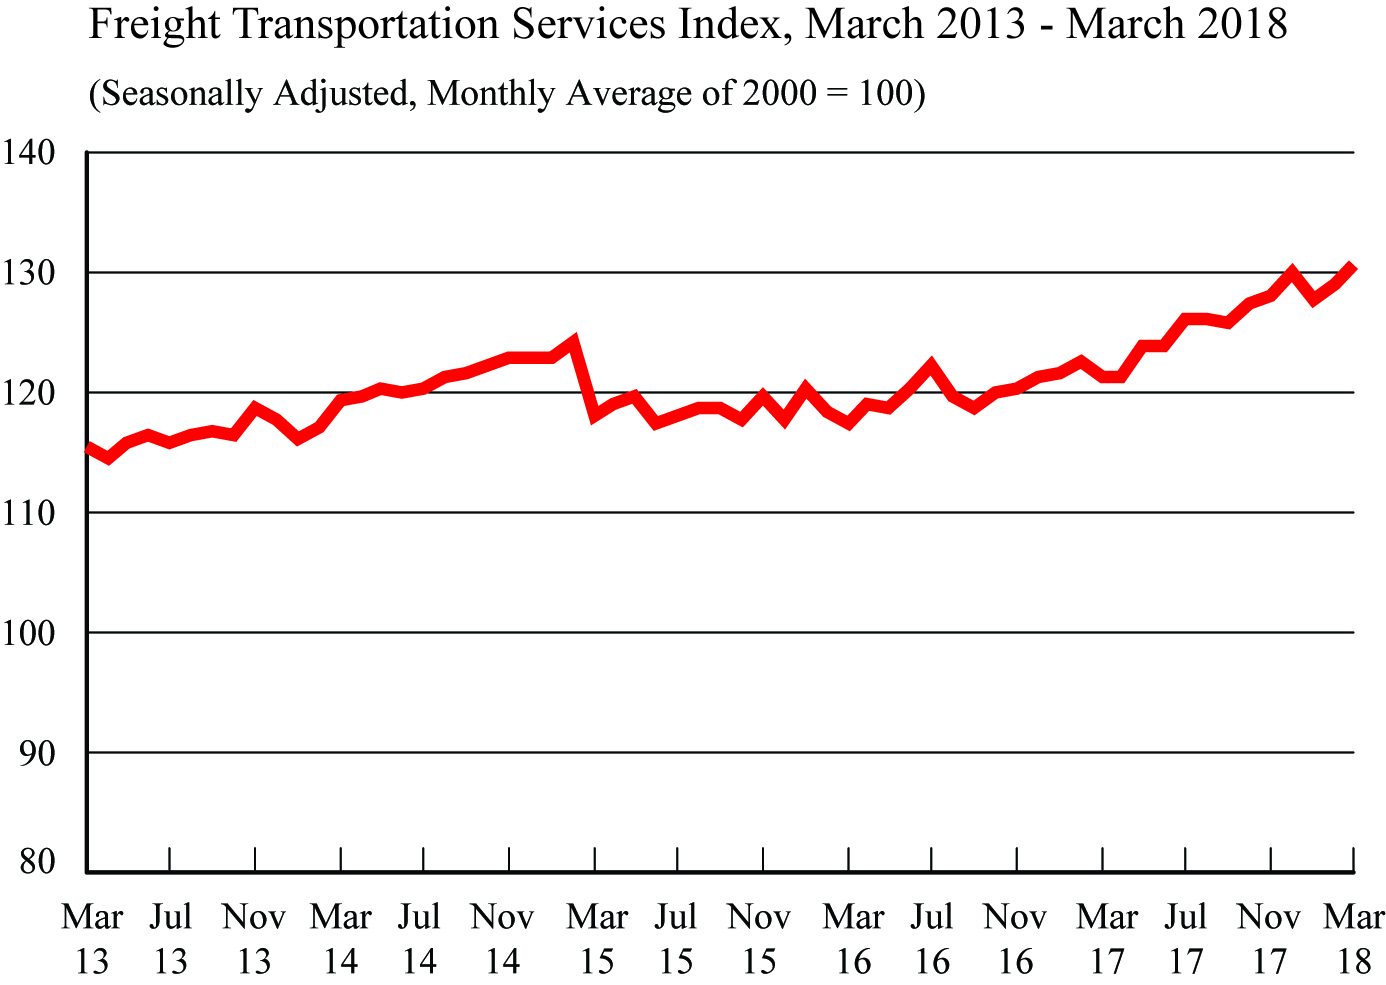 - Airline Traffic Data, March 2018
Thursday, May 10, 2018 - 11:00am ET U.S. airlines monthly passengers, revenue passenger-miles, available seat-miles and load factor for systemwide, domestic and international. Numbers are seasonally-adjusted and unadjusted. In the previous release for February, U.S. airlines systemwide (domestic and international) scheduled service passenger enplanements rose 1.4 percent from January, rising to 72.8 million to reach a new all-time seasonally-adjusted high. 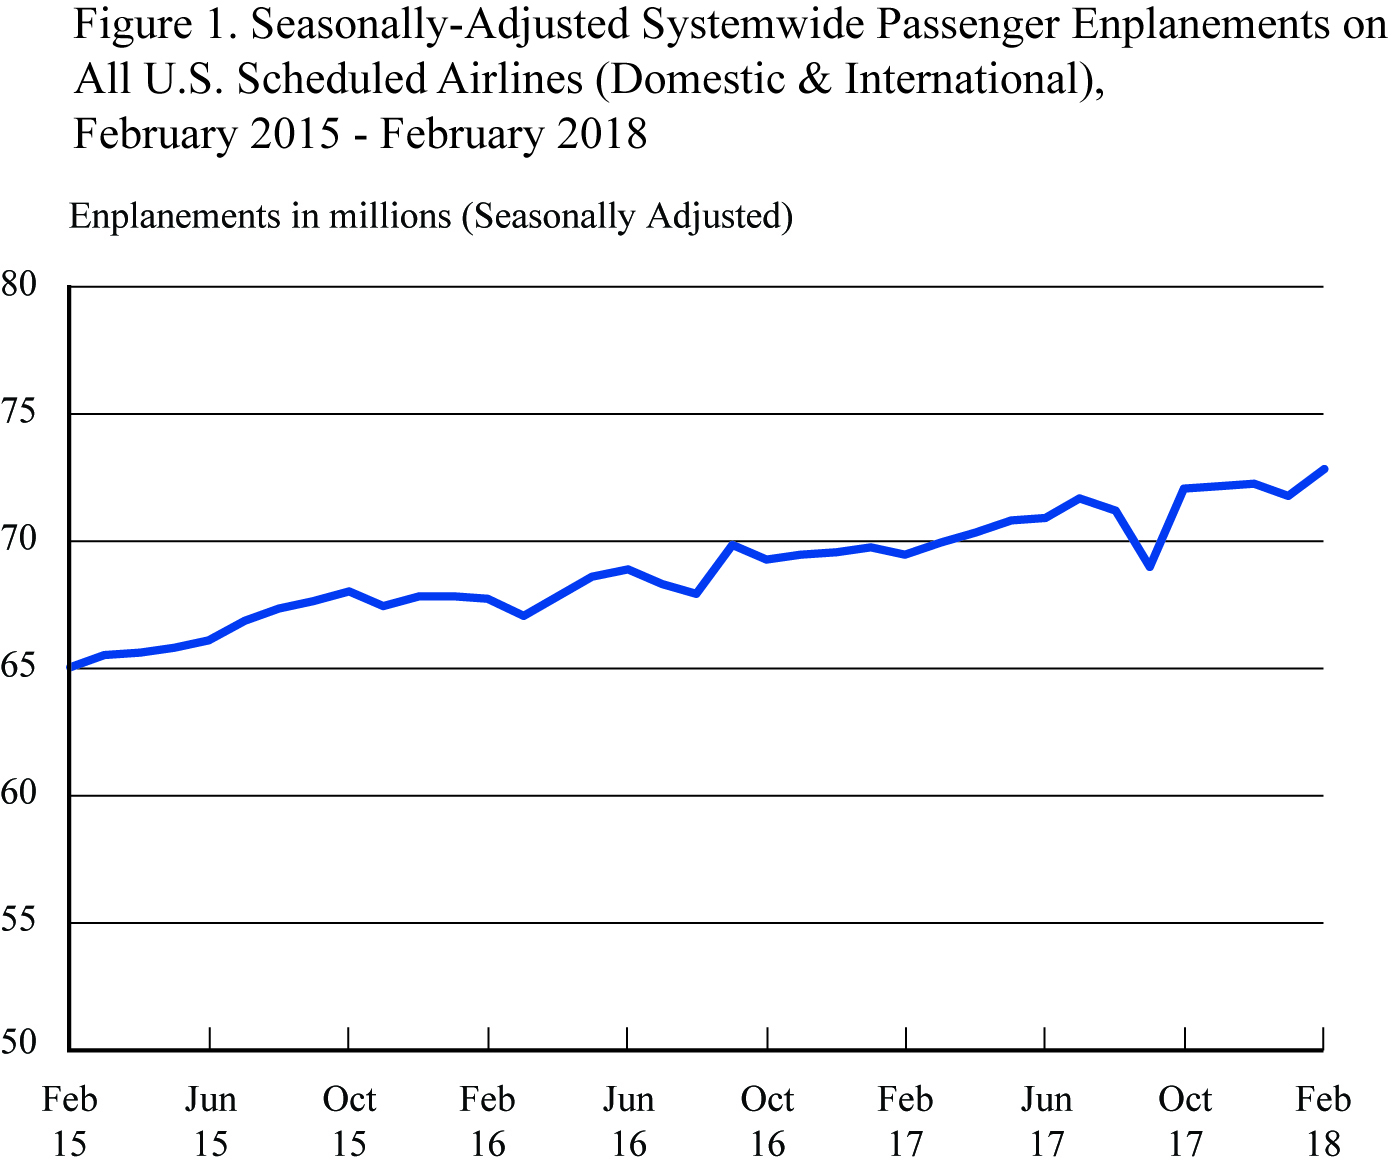
BTS Previously BTS has released the following: - North American Freight Data, March 2018
Tuesday, May 22, 2018 BTS reported that truck was the most used mode for shipping freight between the U.S. and other North American countries (Canada and Mexico) in March 2018 -
Most-used mode: Truck moved $66.5 billion of freight, up 4.1 percent compared to March 2017 -
Second mode: Rail moved $16.1 billion of freight, up 1.9 percent compared to March 2017 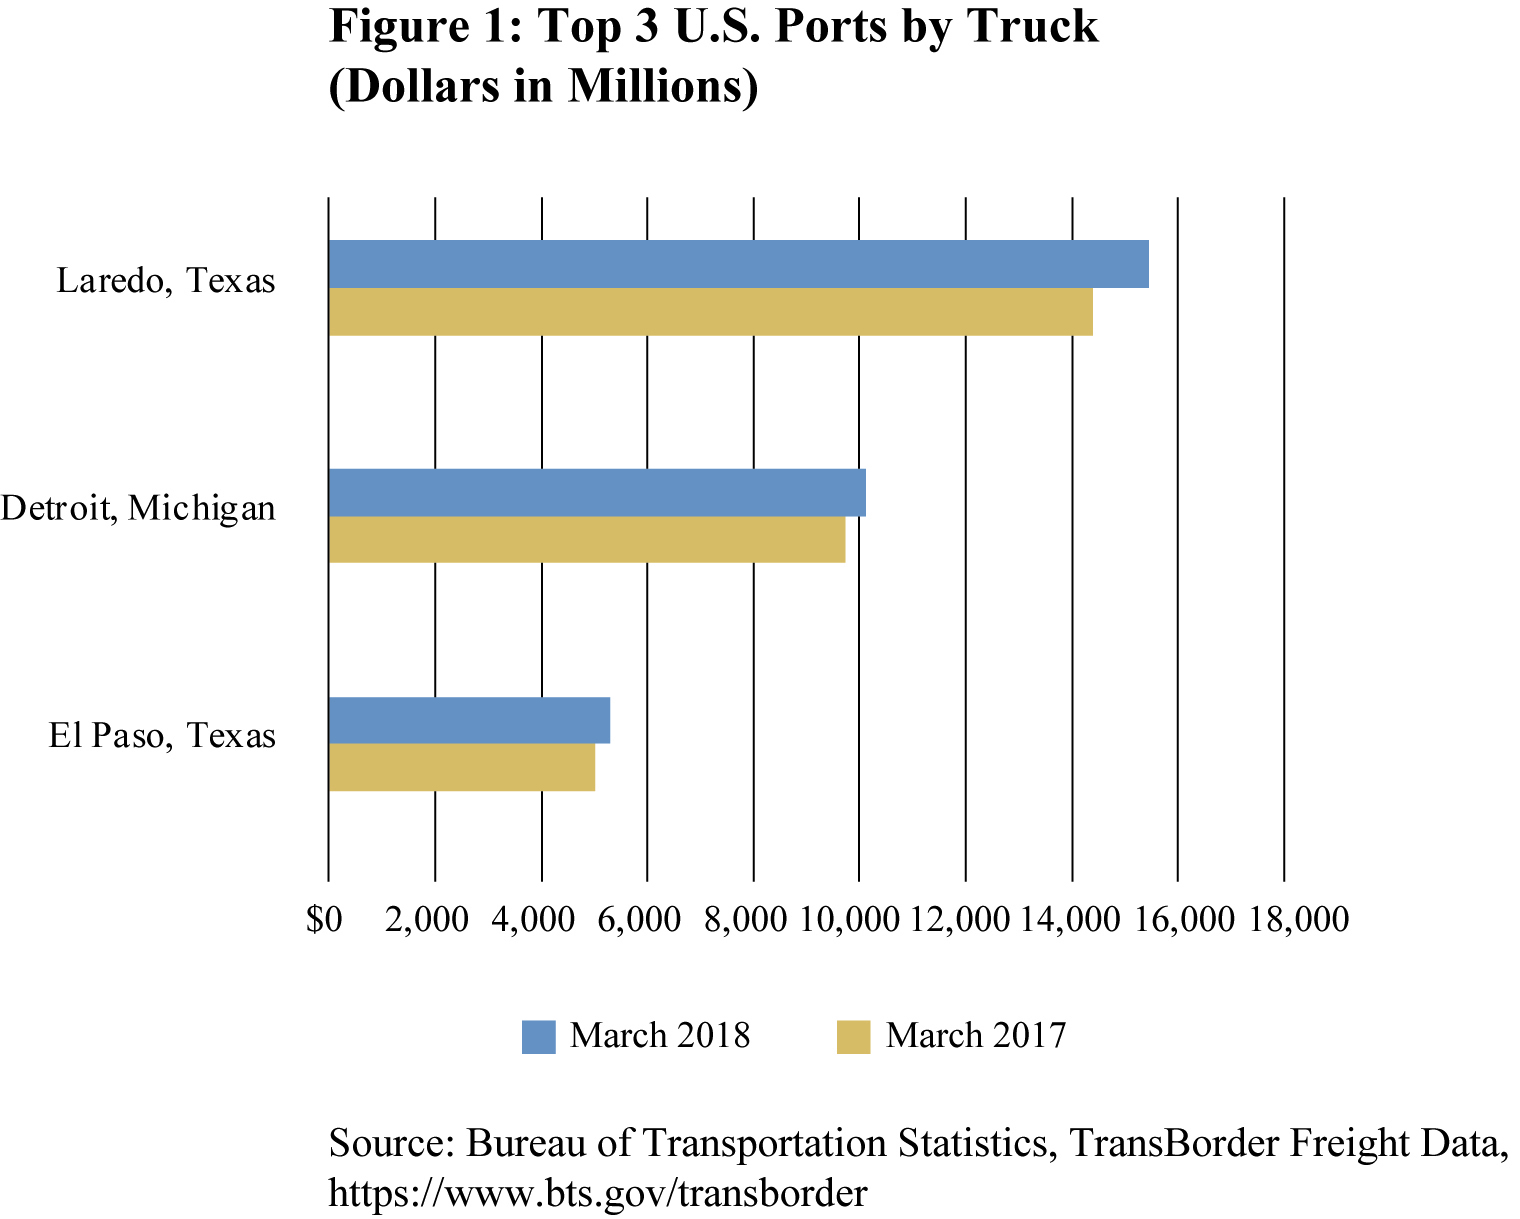
- Airline On-Time Data, March 2018
Wednesday, May 23, 2018 BTS reported that In March 2018, the reporting carriers posted an on-time arrival rate of 80.9 percent, up from both the 79.9 percent on-time rate in March 2017 and the 79.3 percent mark in February 2018. 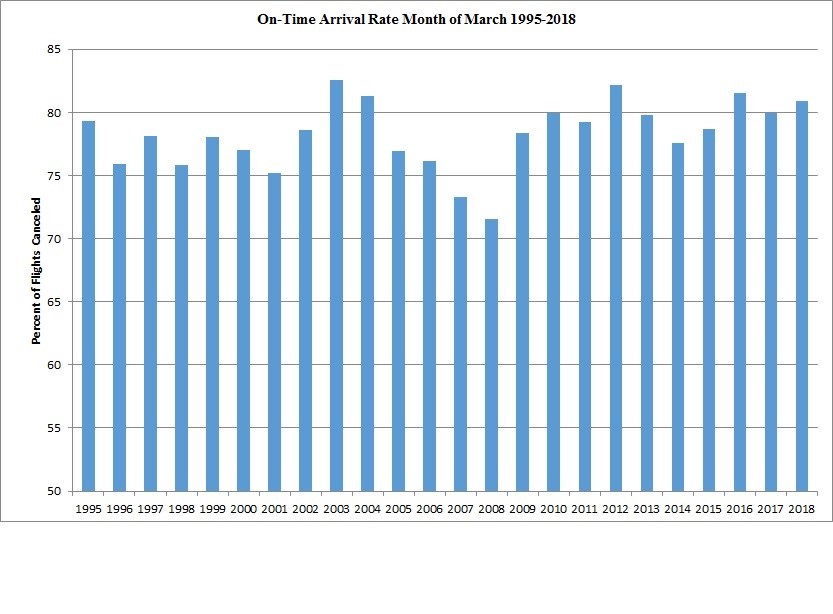 See BTS Release Schedule BTS Contact: Dave Smallen 202-366-5568 david.smallen@dot.gov
| U.S. Department of Transportation | 1200 New Jersey Avenue, SE | Washington DC 20590 | 202-385-HELP (4357) |  | |