Thursday, February 25, 2021 Air Travel Consumer Report: December 2020, Full Year 2020 Numbers WASHINGTON – The U.S. Department of Transportation today released its February 2021 Air Travel Consumer Report (ATCR) on reporting marketing and operating air carrier data compiled for the month of December 2020 and calendar year 2020. The ATCR is designed to assist consumers with information on the quality of services provided by airlines. The full consumer report and other aviation consumer matters of interest to the public can be found at http://www.transportation.gov/airconsumer.
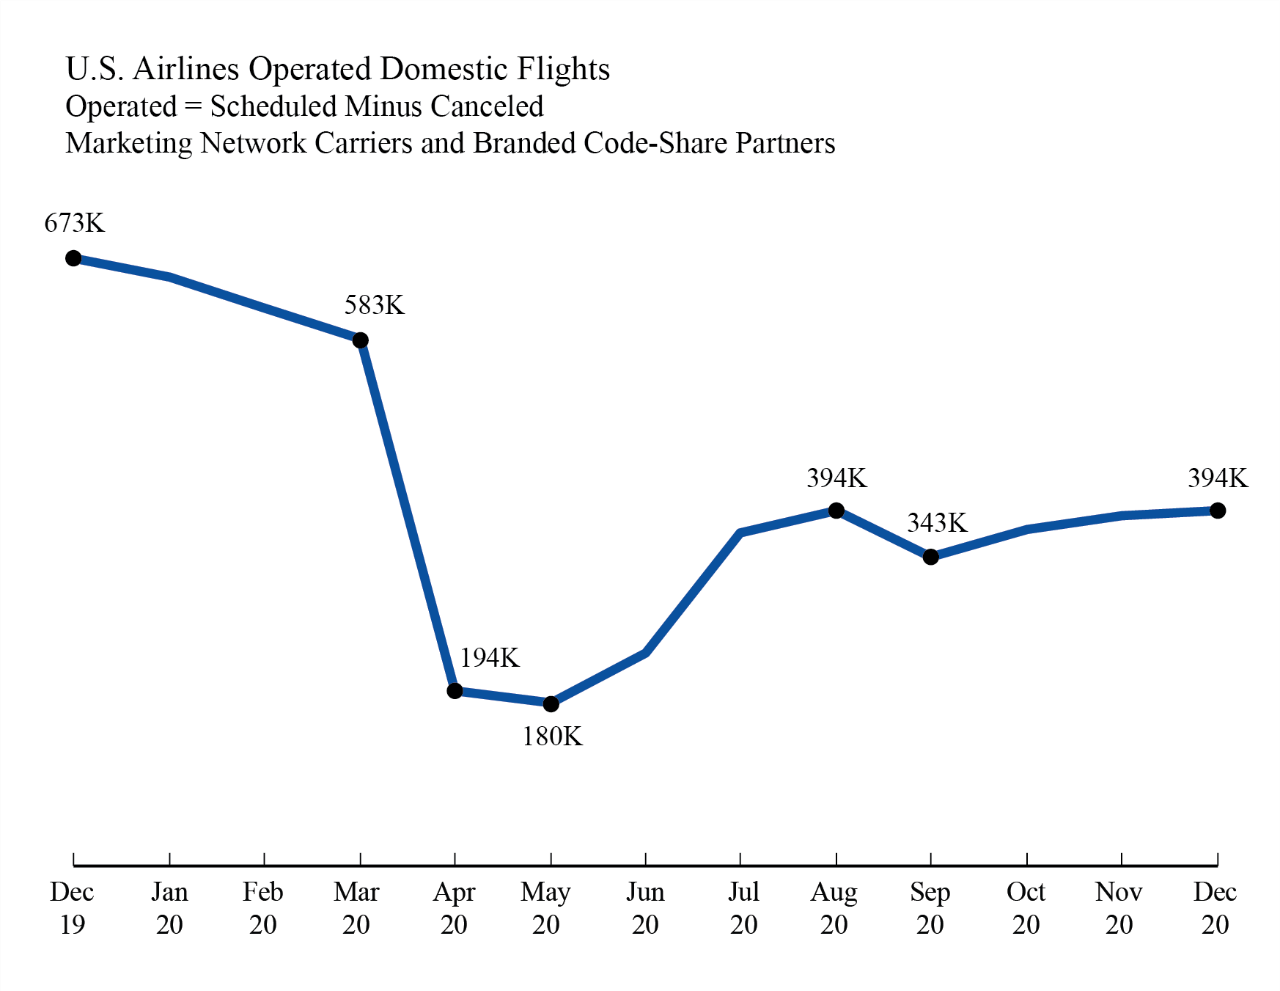
The Coronavirus Disease 2019 (COVID-19) public health emergency has resulted in significant changes to airline schedules and operations, contributing to airlines' on-time performance and cancellation statistics in December 2020 and the full year 2020. ExpressJet Airlines ceased operations on Sept. 30, 2020 and no longer reports Airline Service Quality Performance Data to DOT. The 10 marketing network carriers reported 397,802 scheduled domestic flights in December 2020 compared to 389,587 flights in November 2020 and 679,941 flights in December 2019. Of those 397,802 scheduled flights, 1.1%, 4,253 flights, were canceled. As a result of schedule reductions and cancellations, the carriers reported operating 393,549 flights in December 2020, compared to 387,481 flights in November 2020 and the all-time monthly low of 180,151 flights in May 2020. Airlines operated 672,725 flights in December 2019. For the full year 2020, airlines operated 4,721,342 flights compared to 7,938,055 flights in full year 2019. This is the lowest number of flights operated in a given year since reporting began in 1987.
2020 On-Time Performance For the full year 2020, marketing carriers posted an on-time arrival rate of 84.5%, a higher rate than 79.0% in 2019. Canceled flights are included in calculations of on-time arrival performance. Highest Marketing Carrier On-Time Arrival Rates January-December 2020 (ATCR Table 1B)
Lowest Marketing Carrier On-Time Arrival Rates January-December 2020 (ATCR Table 1B)
December On-Time Performance In December 2020, reporting marketing carriers posted an on-time arrival rate of 87.2%, down from 91.7% in November 2020 but up from 78.2% in December 2019. Highest Marketing Carrier On-Time Arrival Rates December 2020 (ATCR Table 1)
Lowest Marketing Carrier On-Time Arrival Rates December 2020 (ATCR Table 1)
2020 Cancellations For the full year 2020, marketing carriers canceled 6.0% of their scheduled domestic flights, compared to a rate of 1.9% in 2019. A flight is listed as canceled if it was listed in a carrier's computer reservation system during the seven calendar days prior to a scheduled departure but was not operated Lowest Marketing Carrier Rates of Canceled Flights January-December 2020 (ATCR Table 6B)
Highest Marketing Carrier Rates of Canceled Flights January-December 2020 (ATCR Table 6B)
December Cancellations In December 2020, reporting marketing carriers canceled 1.1% of their scheduled domestic flights, higher than the rate of 0.5% in November 2020 but equal to 1.1% in December 2019. Lowest Marketing Carrier Rates of Canceled Flights December 2020 (ATCR Table 6)
Highest Marketing Carrier Rates of Canceled Flights December 2020 (ATCR Table 6)
Tarmac Delays In 2020, airlines reported 55 tarmac delays of more than three hours on domestic flights, a decrease from the 305 such tarmac delays reported in 2019. In 2020, airlines reported six tarmac delays of more than four hours on international flights, compared to 26 such tarmac delays reported in 2019. In December 2020, airlines reported three tarmac delays of more than three hours on domestic flights, compared to no tarmac delays reported in November 2020 and 24 tarmac delays reported in December 2019. In December 2020, airlines reported two tarmac delays of more than four hours on international flights, compared to no tarmac delays reported in November 2020 and four tarmac delays in December 2019. Airlines are required to have and adhere to assurances that they will not allow aircraft to remain on the tarmac for more than 3 hours for domestic flights and 4 hours for international flights without providing passengers the option to deplane, subject to exceptions related to safety, security, and Air Traffic Control related reasons. Extended tarmac delays are investigated by the Department. Mishandled Baggage In calendar year 2020, the reporting marketing carriers posted a mishandled baggage rate of 4.11 mishandled bags per 1,000 checked bags, a lower rate than the 2019 rate of 5.85 per 1,000 checked bags. In December 2020, the reporting marketing carriers posted a mishandled baggage rate of 4.21 mishandled bags per 1,000 checked bags, a higher rate than the November 2020 rate of 3.04 per 1,000 checked bags and lower than the December 2019 rate of 6.61 per 1,000 checked bags. See the February 2021 Air Travel Consumer Report for mishandled baggage numbers by airline. Mishandled Wheelchairs and Scooters In calendar year 2020, reporting marketing airlines reported checking 268,676 wheelchairs and scooters and mishandling 3,464, a rate of 1.29% mishandled, compared to the rate of 1.54% in 2019. In 2019, reporting marketing airlines reported checking 685,792 wheelchairs and scooters and mishandling 10,548. In December 2020, reporting marketing airlines reported checking 19,328 wheelchairs and scooters and mishandling 223, a rate of 1.15% mishandled, lower than both the rate of 1.22% mishandled in November 2020 and 1.53% in December 2019. In December 2019, the airlines checked 65,345 wheelchairs and scooters, mishandling 1,001. See the February 2021 Air Travel Consumer Report for mishandled wheelchair and scooter numbers by airline. Bumping/Oversales Bumping/oversales data, unlike other air carrier data, are reported quarterly rather than monthly. For the full year 2020, the marketing carriers posted a bumping rate of 0.11 per 10,000 passengers compared to a rate of 0.24 per 10,000 passengers in 2019.
For the fourth quarter of 2020, the 10 U.S. marketing carriers posted an involuntary denied boarding, or bumping, rate of 0.03 per 10,000 passengers, down from both the marketing carrier rate of 0.17 for the third quarter of 2020 and the rate of 0.16 in the fourth quarter of 2019.
See the February 2021 Air Travel Consumer Report for denied boarding numbers by airline. Incidents Involving Animals In 2020, carriers reported six animal deaths, injuries to four other animals, and zero lost animals, for a total of 10 incidents, down from the 19 total incident reports filed for calendar year 2019. In 2020, 311,149 animals were transported by airlines, for a rate of 0.32 incidents per 10,000 animals transported. In 2019, 404,556 animals were transported, for a rate of 0.47 incidents per 10,000 animals transported.
In December 2020, carriers reported one incident involving the death, injury, or loss of an animal while traveling by air, down from the two reports filed in December 2019, but up from the zero reports filed in November 2020. December's incident involved the death of one animal. Complaints About Airline Service In 2020, the Department received 102,550 complaints, the highest number on record. This is up 568.4 percent from the total of 15,342 received in 2019. Of the 102,550 complaints received in 2020, 89,518 (87.29%) concerned refunds. The Department's Office of Aviation Consumer Protection has been in direct communication with the largest U.S. and foreign air carriers and other carriers that received a large number of refund complaints to ensure compliance with the refund requirements. Many passengers who had initially been denied refunds have received the required refunds. The Department will take enforcement action against noncompliant airlines and ticket agents as necessary.
In December 2020, DOT received 3,846 complaints about airline service from consumers, up 2.4% from the 3,756 received in November 2020 and up 208.7% from the total of 1,246 filed in December 2019.
Complaints About Treatment of Disabled Passengers In 2020, the Department received 528 disability complaints, down 41.7 percent from the total of 905 received in 2019. Of the 528 disability complaints, 107 were complaints from persons who assert they have a disability that precludes their wearing a mask. The Department has issued a notice on accommodation by carriers of persons with disabilities who are unable to wear or safely wear masks while on commercial aircraft at https://www.transportation.gov/airconsumer/masks-notice-of-enforcement-policy. In December 2020, the Department received a total of 43 disability-related complaints, up from the 38 complaints received in November 2020, but down from the 88 complaints received in December 2019. The Air Carrier Access Act and the Department's implementing regulation prohibit discrimination by airlines against individuals on the basis of disability. All complaints alleging discrimination on the basis of disability are investigated by the Department. Complaints About Discrimination In 2020, the Department received 48 discrimination complaints – 33 complaints regarding race, one complaint regarding ancestry/ethnicity, eight complaints regarding national origin, four complaints regarding religion, and two complaints categorized as "other." This is a decrease of 55.1 percent from the total of 107 filed in 2019. In December 2020, the Department received five complaints alleging discrimination – three complaints regarding race and two complaints regarding national origin. This is up from the two complaints received in November 2020, but down from the nine complaints recorded in December 2019.
Federal law prohibits discrimination in air transportation by airlines on the basis of a person's race, color, national origin, religion, ancestry, or sex. The Department investigates all complaints that it receives alleging discrimination. Consumers may file air travel consumer or civil rights complaints online at http://airconsumer.dot.gov/escomplaint/ConsumerForm.cfm or by voicemail at (202) 366-2220, or they may mail a complaint to the Aviation Consumer Protection Division, U.S. Department of Transportation, C-75, W96-432, 1200 New Jersey Avenue, SE, Washington, DC 20590.
###
| ||||||||||||||||||
Air Travel Consumer Report: December 2020, Full Year 2020 Numbers


Subscribe to:
Post Comments (Atom)
No comments:
Post a Comment