BTS 2-Week Outlook Bureau of Transportation Statistics Upcoming Releases October 28 thru November 8 Upcoming from October 28 Monday, October 28, 2019 – 11:00am ET WMATA Close Call Program Report 2013-2018
Tuesday, October 29, 2019 – 11:00am ET 2019 Rail Tank Car Safety Report
Wednesday, November 6, 2019 - 11:00am ET Airline Fuel Cost and Consumption, September 2019
Thursday, November 7, 2019 - 11:00am ET Airline Full-Time/Part-Time Employment, September 2019
TBD Airline On-Time/Tarmac Times, September 2019 Previously Released Oct 15 - Airline On-Time/Tarmac Times, August 2019 Oct. 15 - Average Air Fares, 2nd Quarter 2019 Oct 16 - Passenger Airline Employment, August 2019 Oct 23 - North American Freight Data, August 2019 Oct 25 - National Transportation Atlas Database (NTAD), Fall 2019 Update
The Bureau of Transportation Statistics will release the following data sets in the next two weeks:
Monday, October 28, 2019 – 11:00am ET BTS will release WMATA Close Call Program Report 2013-2018, detailing the six-year results of the close calls program that encourages employees to confidentially and voluntarily report unsafe conditions or events – close calls – that could result in illness, injury, damage or loss. A close call is an event or condition that had the possibility for serious consequences but did not progress to an adverse safety event.
Tuesday, October 29, 2019 – 11:00am ET BTS will release Fleet Composition of Rail Tank Cars Carrying Flammable Liquids: 2019 Report, measuring industry-wide progress in manufacturing and modifying safer rail tank cars that transport flammable liquids
Thursday, October 3, 2019 - 11:00am ET Previous release: U.S. airlines August fuel cost was $1.94/gal, down 4 cents from July 2019 ($1.98) and down 26 cents from August 2018 ($2.20). Industry summary of airline fuel consumption, total fuel cost and price paid per gallon are available on the database. Individual airline numbers through March are available on the BTS website.
Monday, October 7, 2019 - 11:00am ET Previous release: U.S. airlines August employment (742,431 total full-time and part-time) was down 0.2% from July 2019 and up 3.2% from August 2018 (passenger+cargo). Monthly full-time and part-time employment statistics are reported by U.S. airlines that operate at least one aircraft that has more than 60 seats or the capacity to carry a payload of passengers, cargo and fuel weighing more than 18,000 pounds.
BTS Previously
BTS has released the following:
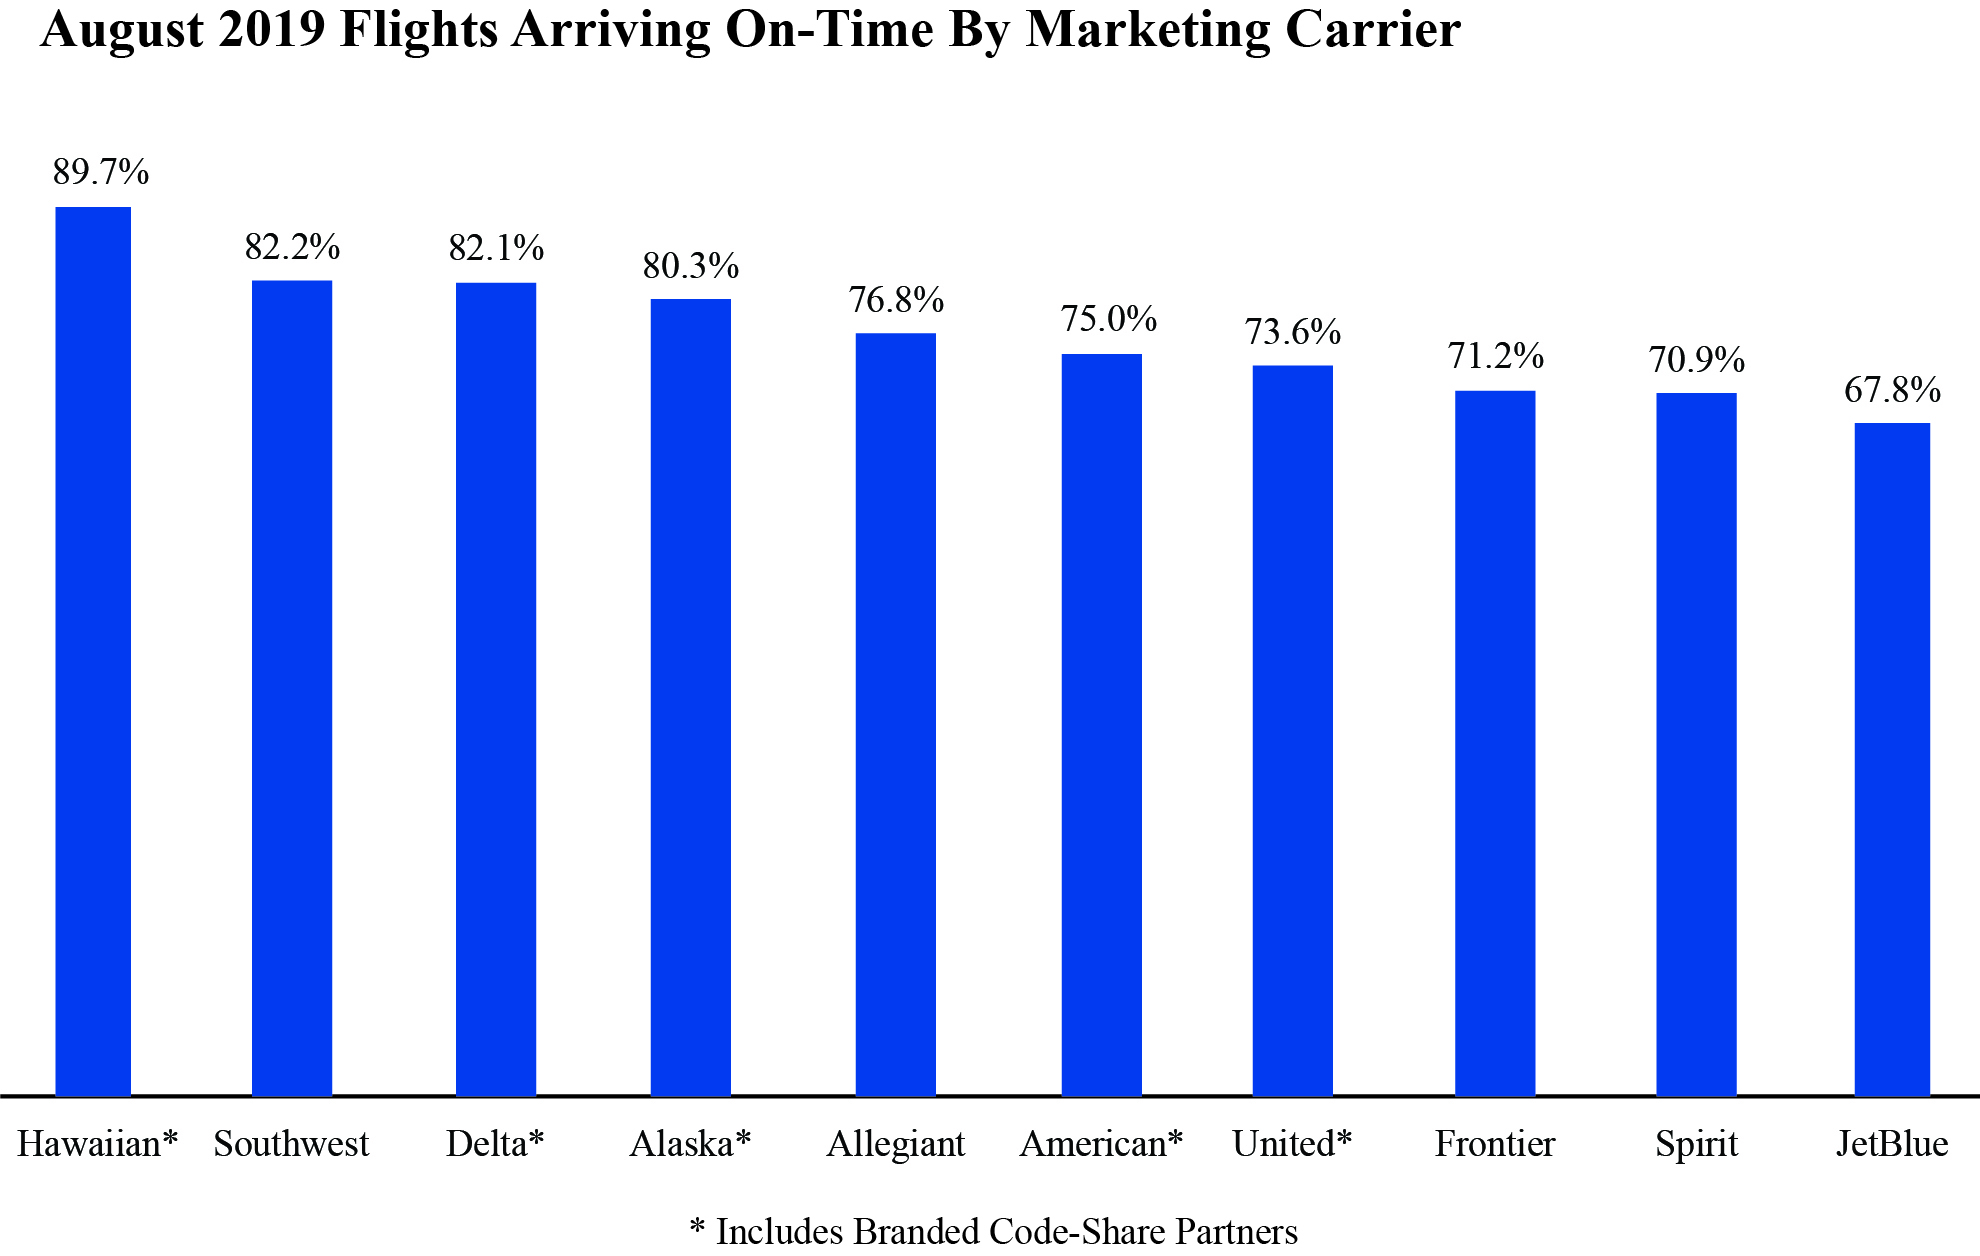
Oct. 15 In August 2019, reporting marketing carriers posted an on-time arrival rate of 77.6%, up from both the 76.9% on-time rate in July 2019 and from 75.2% in August 2018. The reporting marketing carriers canceled 1.8% of their scheduled domestic flights, lower than both the rate of 2.1% in July 2019 and 2.0% in August 2018.
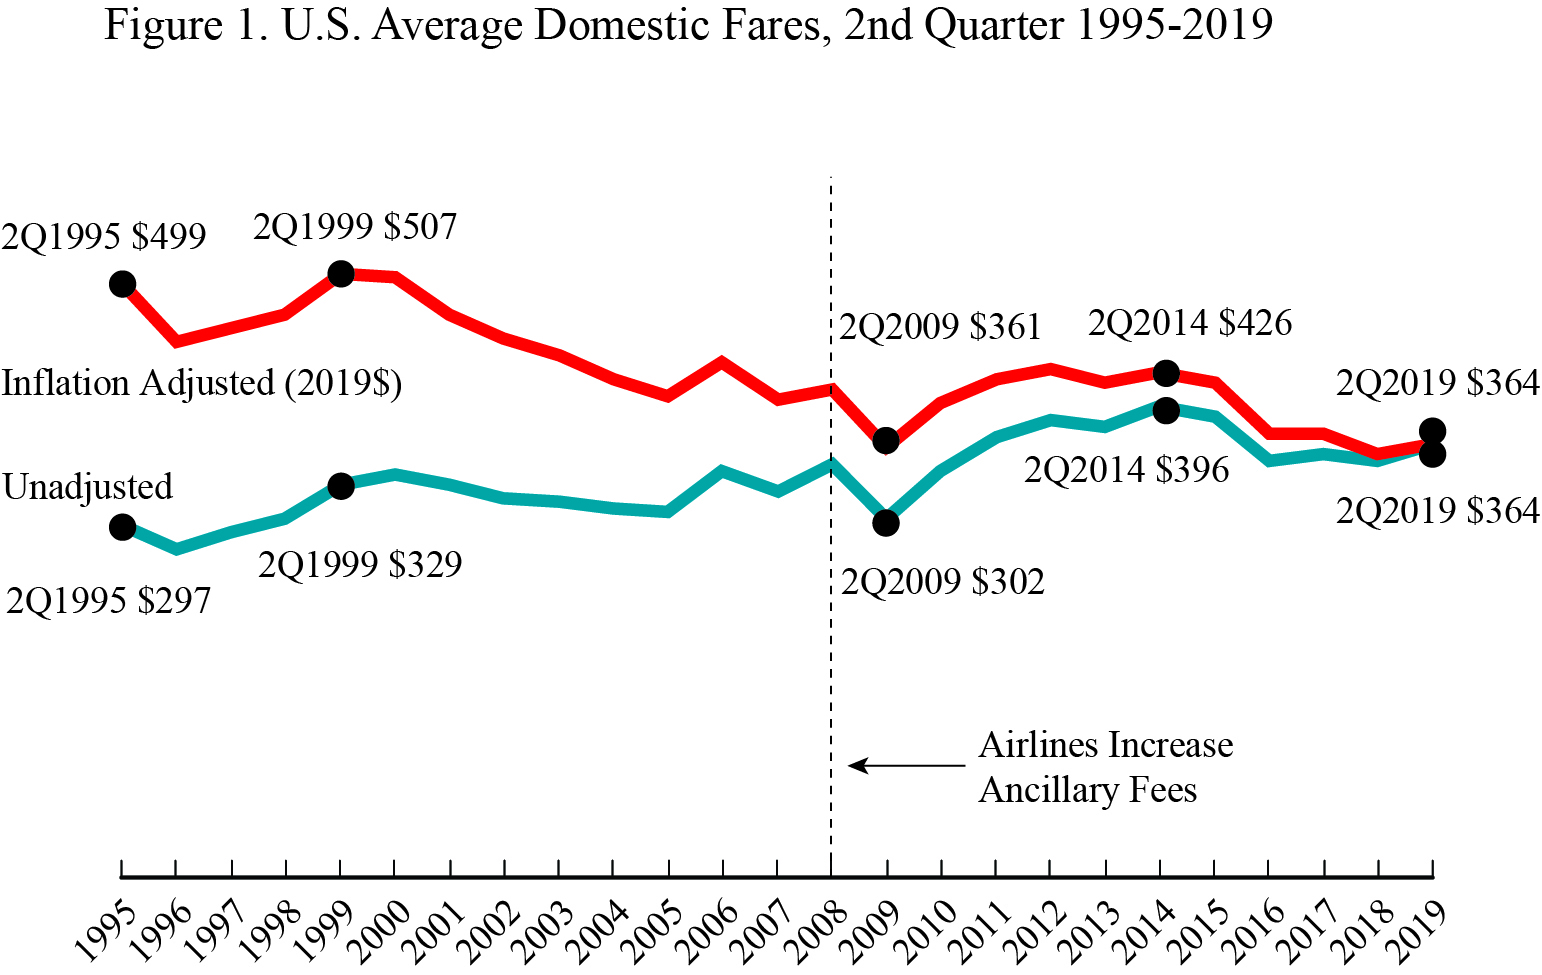
Oct 15 The second-quarter 2019 average domestic itinerary air fare of $$364 was an increase from both the first quarter of 2019 ($358) and the second quarter of 2018 (355), adjusted for inflation.
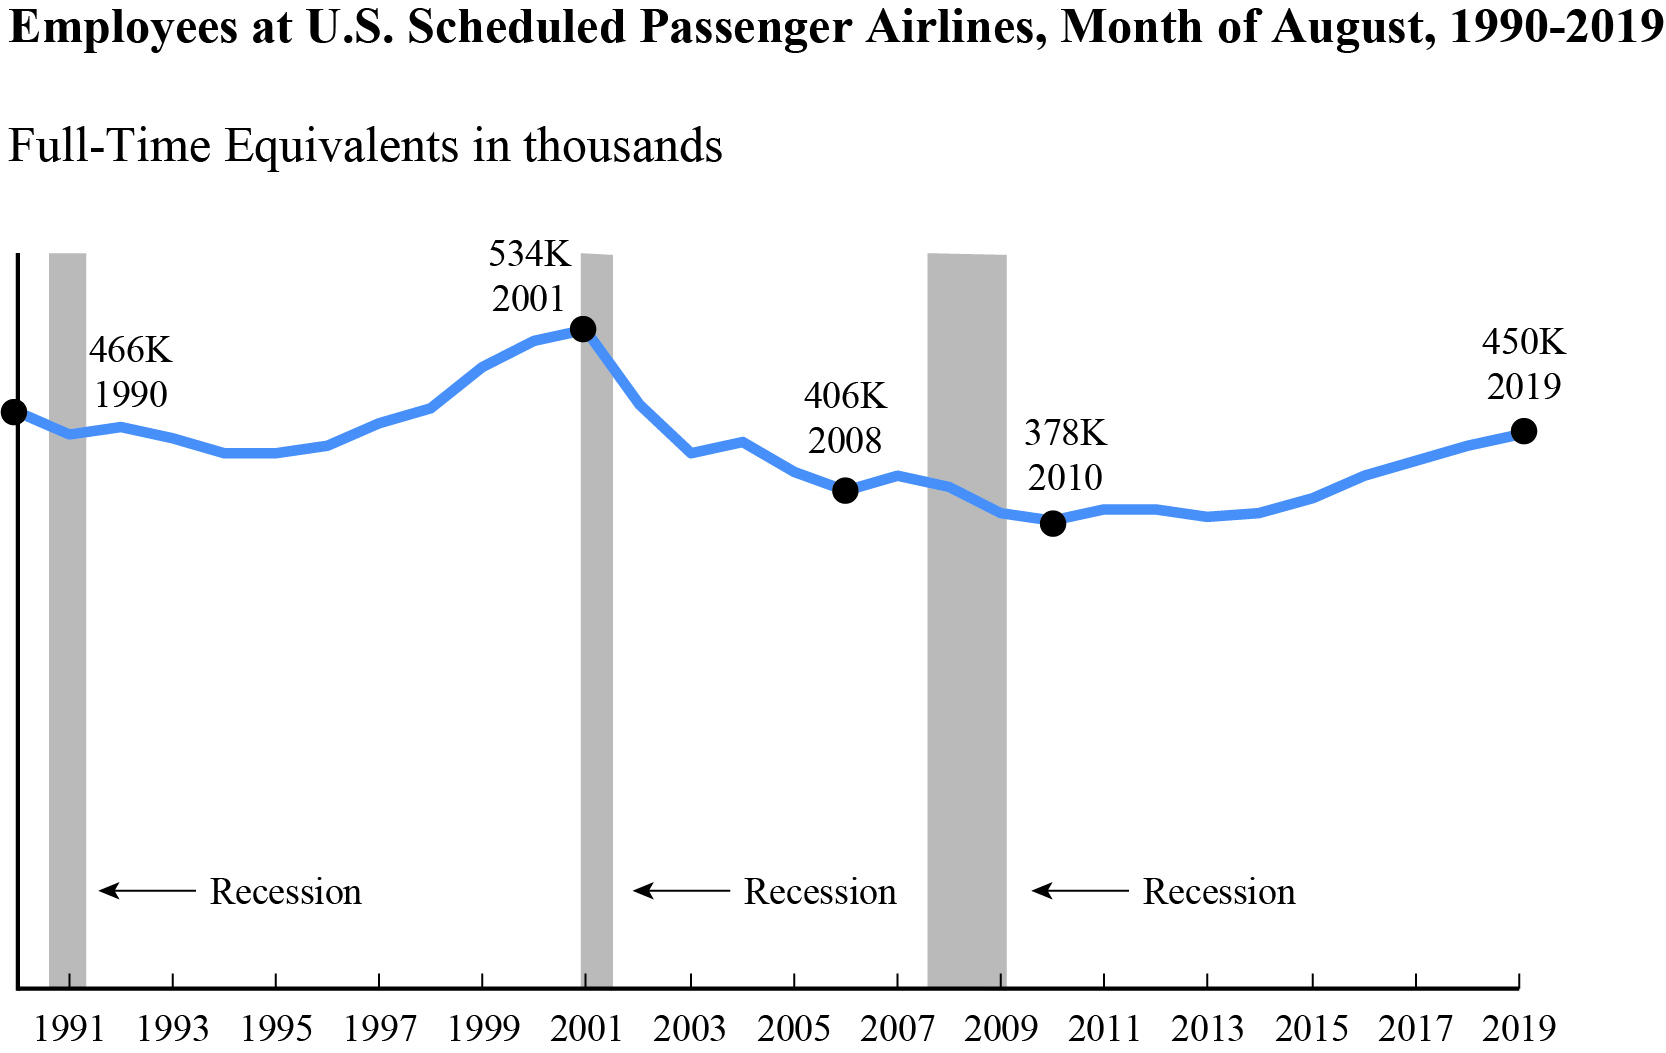
Oct. 16 BTS reported that U.S. scheduled passenger airlines employed 2.3% more workers in August 2019 than in August 2018.
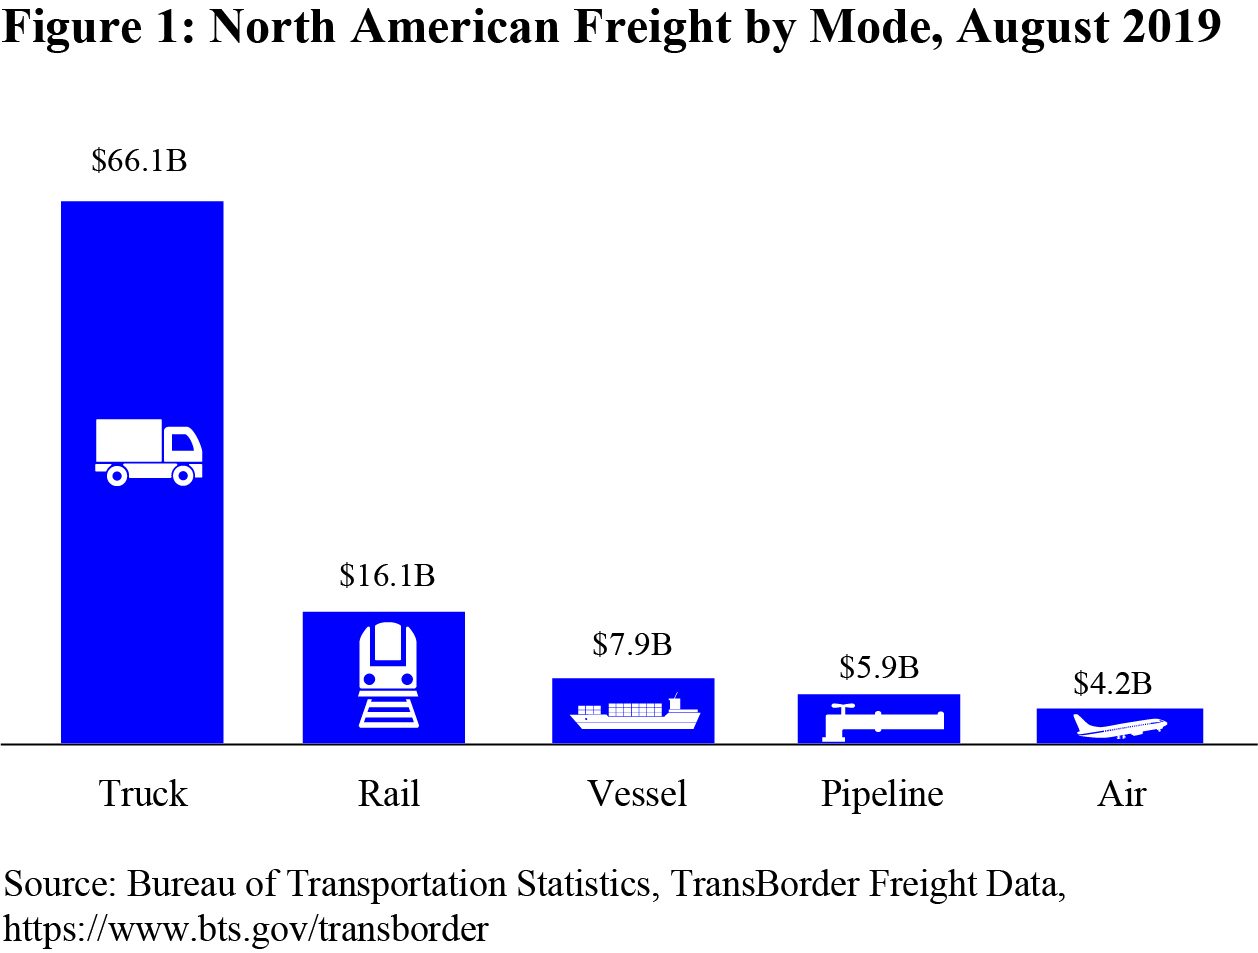
Oct. 23 BTS reported that truck was the most used mode for shipping freight between the U.S. and other North American countries (Canada and Mexico) in August 2019:
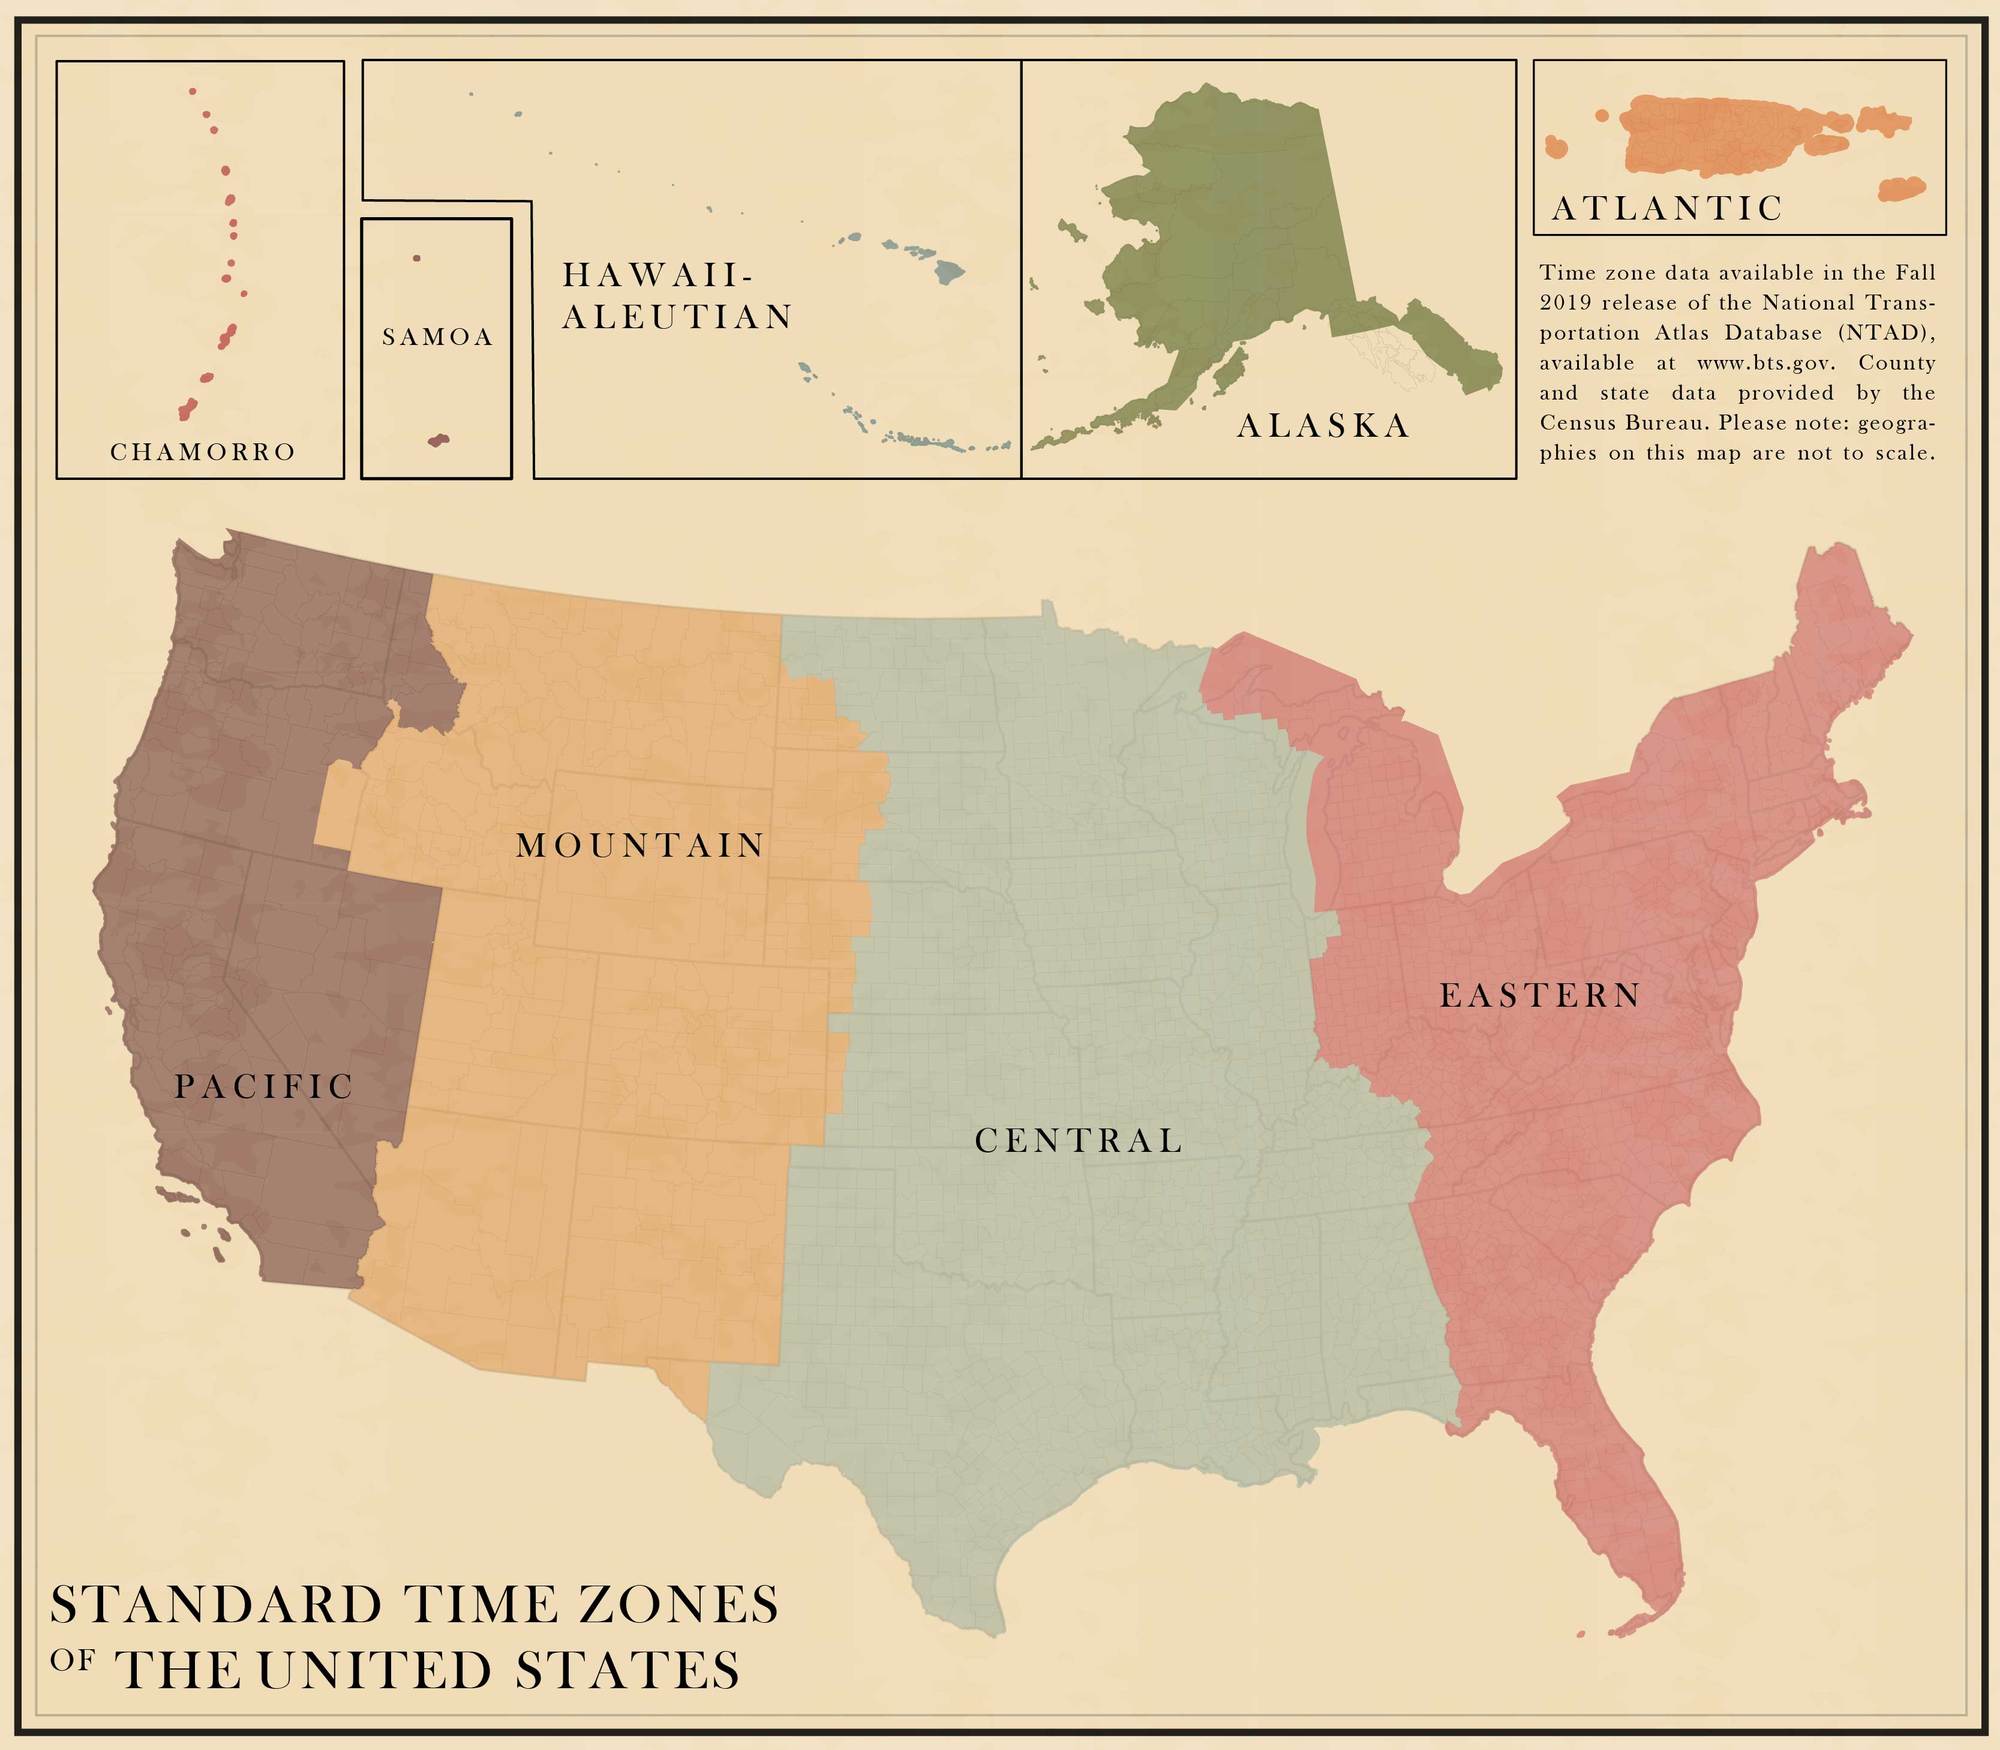
Oct. 25 NTAD is a BTS compilation of geospatial datasets representing the nation's transportation infrastructure, containing roadways, railways, waterways, and airports. The three new datasets in this version are the National Tunnel Inventory, Time Zones, and the Dockless Bikeshare and E-scooters. See also the Time Zone Layer.
BTS Contact: Dave Smallen 202-366-5568
| ||||||||||||||||||
Bureau of Transportation Statistics Upcoming Releases


Subscribe to:
Post Comments (Atom)
No comments:
Post a Comment