February 2024 U.S. Airline Traffic Data Up 8.6% from the Same Month Last YearThursday, May 9, 2024 BTS 22-24
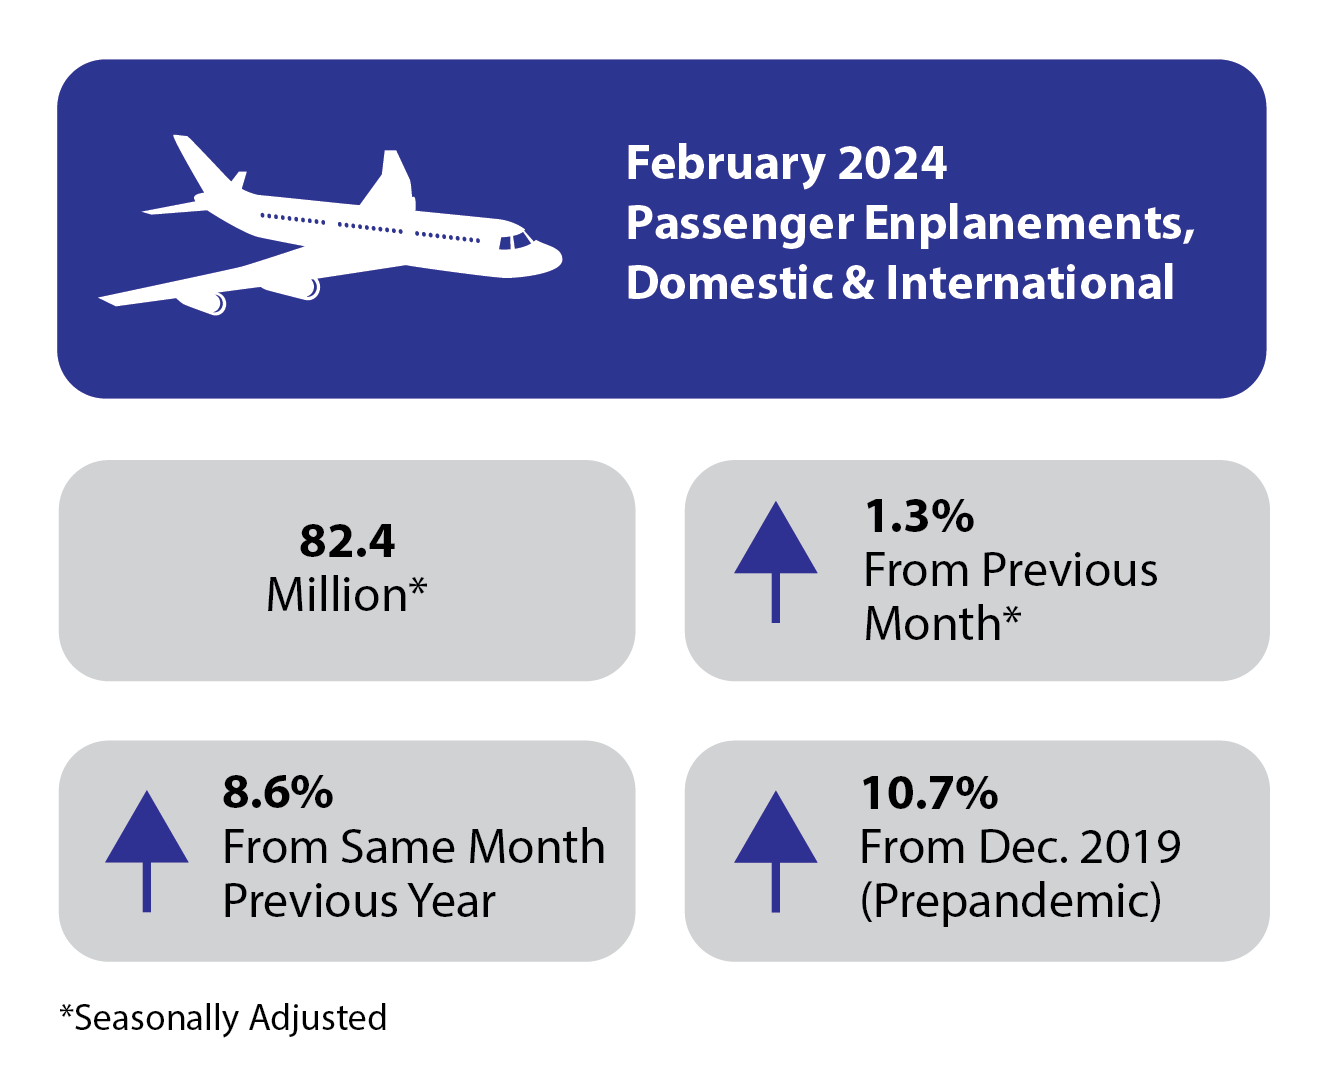
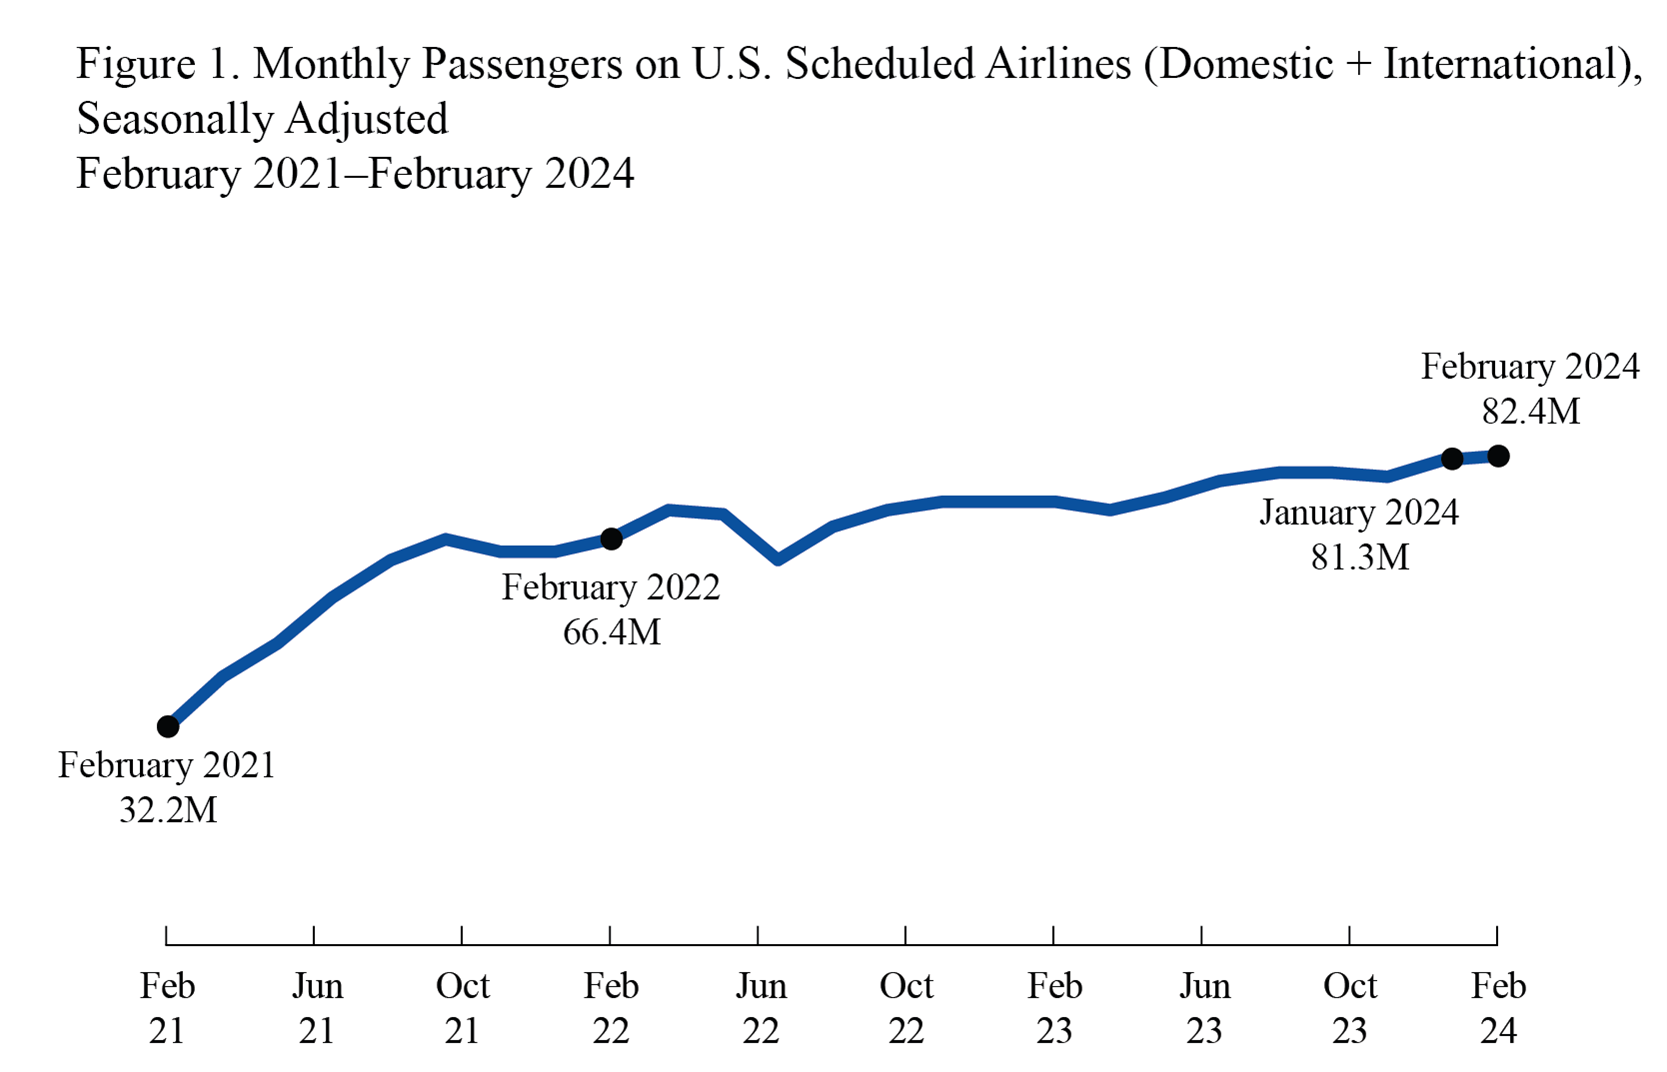
U.S. airlines carried 70.4 million systemwide (domestic and international) scheduled service passengers in February 2024, according to the Bureau of Transportation Statistics (BTS). When adjusted for seasonality, February enplanements are up 1.3% from January and reached a new all-time high the all-time high reached in February 2024. BTS reported 61 million domestic passengers and 9.4 million international passengers on U.S. airlines flights in February, not adjusting for seasonality. U.S. airline traffic reports are filed monthly with BTS. See the tables that accompany this release on the BTS website for summary data since 2016 (Tables 1-24) and complete data since 2000. Two measures of U.S. airlines passenger enplanements February seasonally adjusted
February unadjusted
Table A. Seasonally Adjusted Passenger Enplanements Compared to Previous Time Periods
Table B. Unadjusted Passenger Enplanements Compared to Previous Time Periods
For data filed through February, see accompanying tables. For the complete database of reported data, see Traffic. For an explanation of BTS' seasonal adjustment methodology, see Seasonal Adjustment. Reporting Notes See the BTS Airlines and Airports page for additional scheduled service numbers through February for U.S. airlines. International data by origin and destination is available through November. International totals in this press release consist of all U.S. carrier operations to and from the U.S. and from one foreign point to another foreign point. BTS' Airlines and Airports page does not include U.S. carriers' foreign point-to-point flights. BTS has scheduled June 13 for the release of data through March. None of the data are from samples. Measures of statistical significance do not apply to the complete air traffic data.
| ||||||||||||||||||||||||||||||||||||||||||||||||
February 2024 U.S. Airline Traffic Data Up 8.6% from the Same Month Last Year

Subscribe to:
Post Comments (Atom)
No comments:
Post a Comment