BTS 2-Week Outlook Bureau of Transportation Statistics Upcoming Releases March 1 - 12 Upcoming from March 1
Wednesday, March 3, 2021 - 11:00am ET Airline Fuel Cost and Consumption, January 2021
Monday, March 8, 2021 - 11:00am ET North American Freight Data, Annual 2020
Tuesday, March 9, 2021 - 11:00am ET Airline Full-Time/Part-Time Employment, January 2021
Wednesday, March 10, 2021 - 10:00am ET Transportation Services Index, January 2021
Thursday, March 11, 2021 - 11:00am ET Airline Traffic Data, December 2020 Domestic, September 2020 International
Previously Released
Feb. 16 - U.S. Airlines Passengers, December 2020 (preliminary) Feb. 17 - U.S. Airlines Cargo, December 2020 (preliminary) Feb. 18 - Passenger Airline Employment, December 2020 Feb. 24 - Airline On-Time/Tarmac Data, December 2020 Feb. 25 - Freight Analysis Framework Version 5, Baseline Feb. 25 - North American Freight, December 2020
BTS Releases in the Next Two Weeks
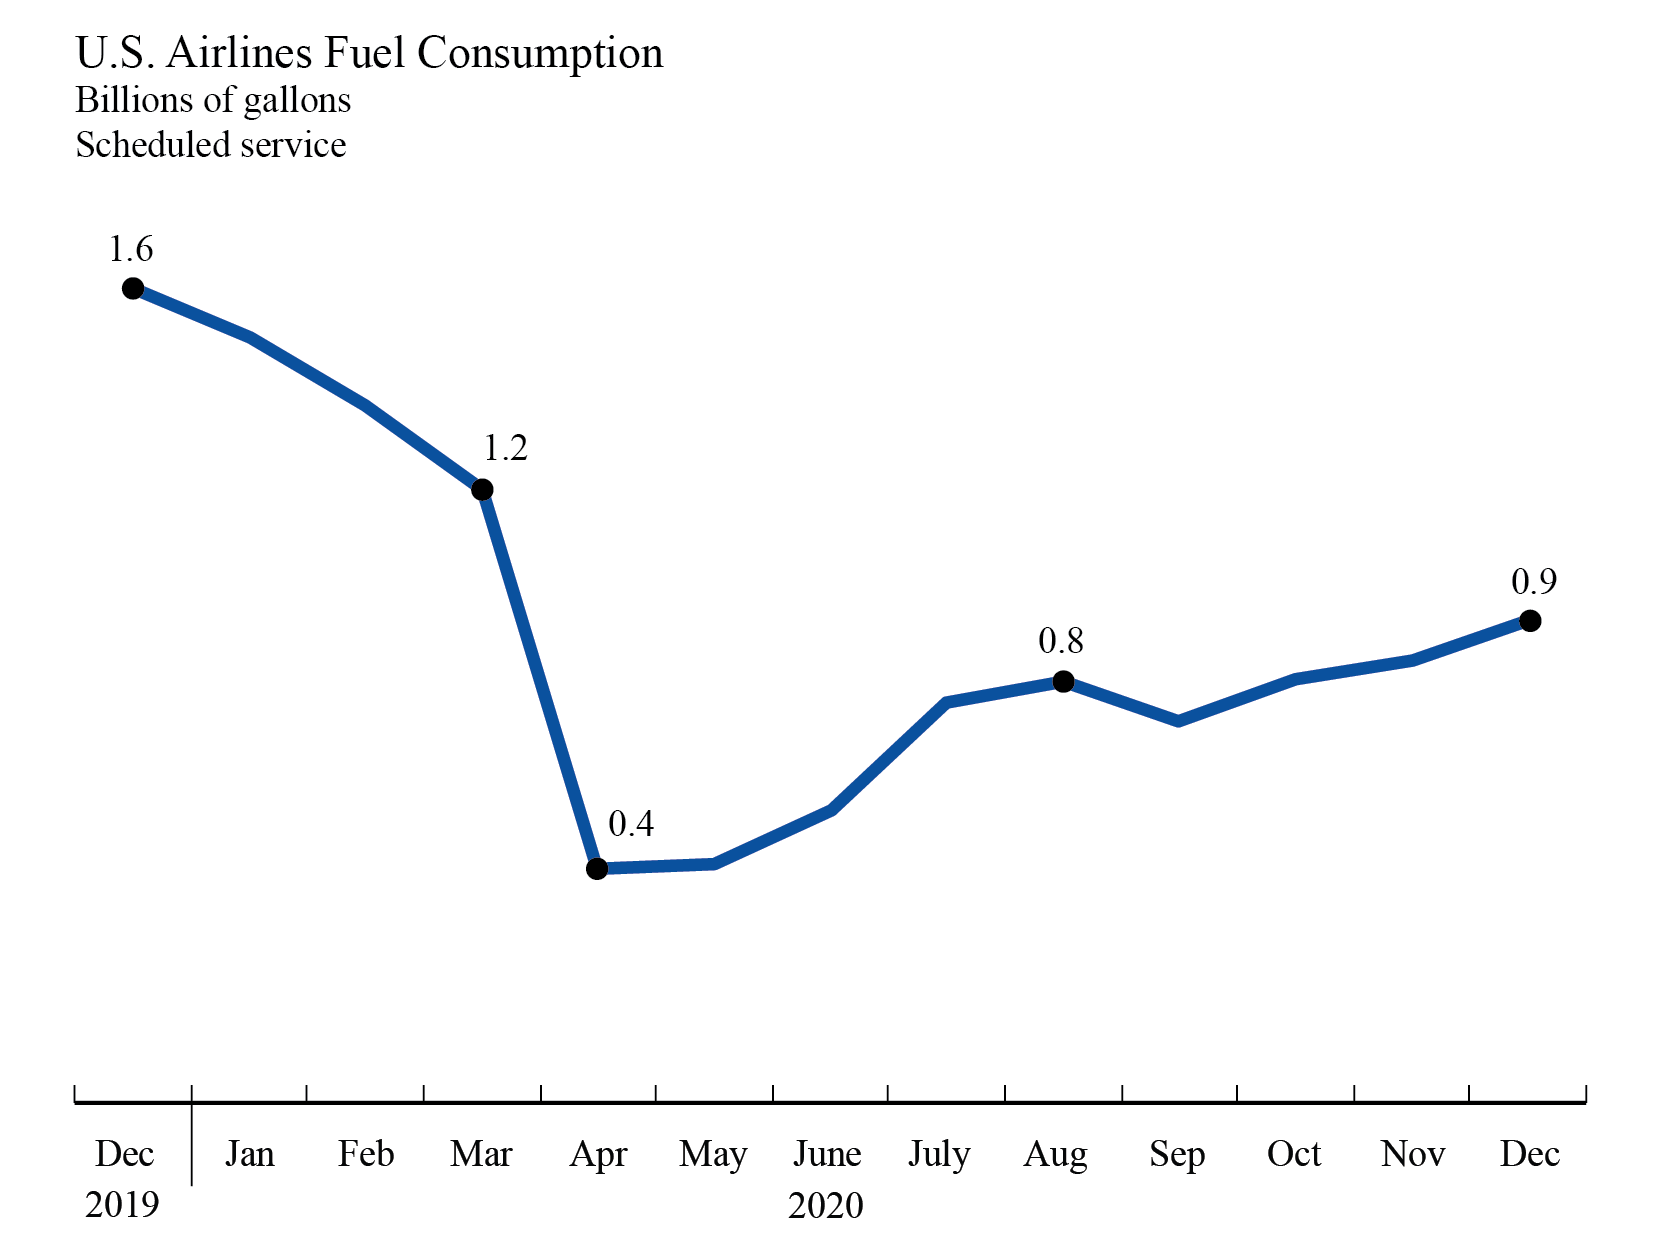
Wednesday, March 3, 2021 - 11:00am ET Previous release: U.S. airlines December 2020 fuel consumption was 9% higher than November 2020 and more than April 2020. April was the lowest monthly fuel usage on record (447M gallons), dating back to 2000. December 2020 fuel consumption was down 63% from December 2019. Fuel consumed by U.S. airlines' scheduled services: December 2019 1.6 billion gallons November 2020 845 million gallons December 2020 918 million gallons Industry summary of airline fuel consumption, total fuel cost and price paid per gallon are available on the database. Individual airline numbers through September are available on the BTS website. Individual airline numbers for October, November and December will be available on May 3. Individual airline numbers for January will be available on June 2.
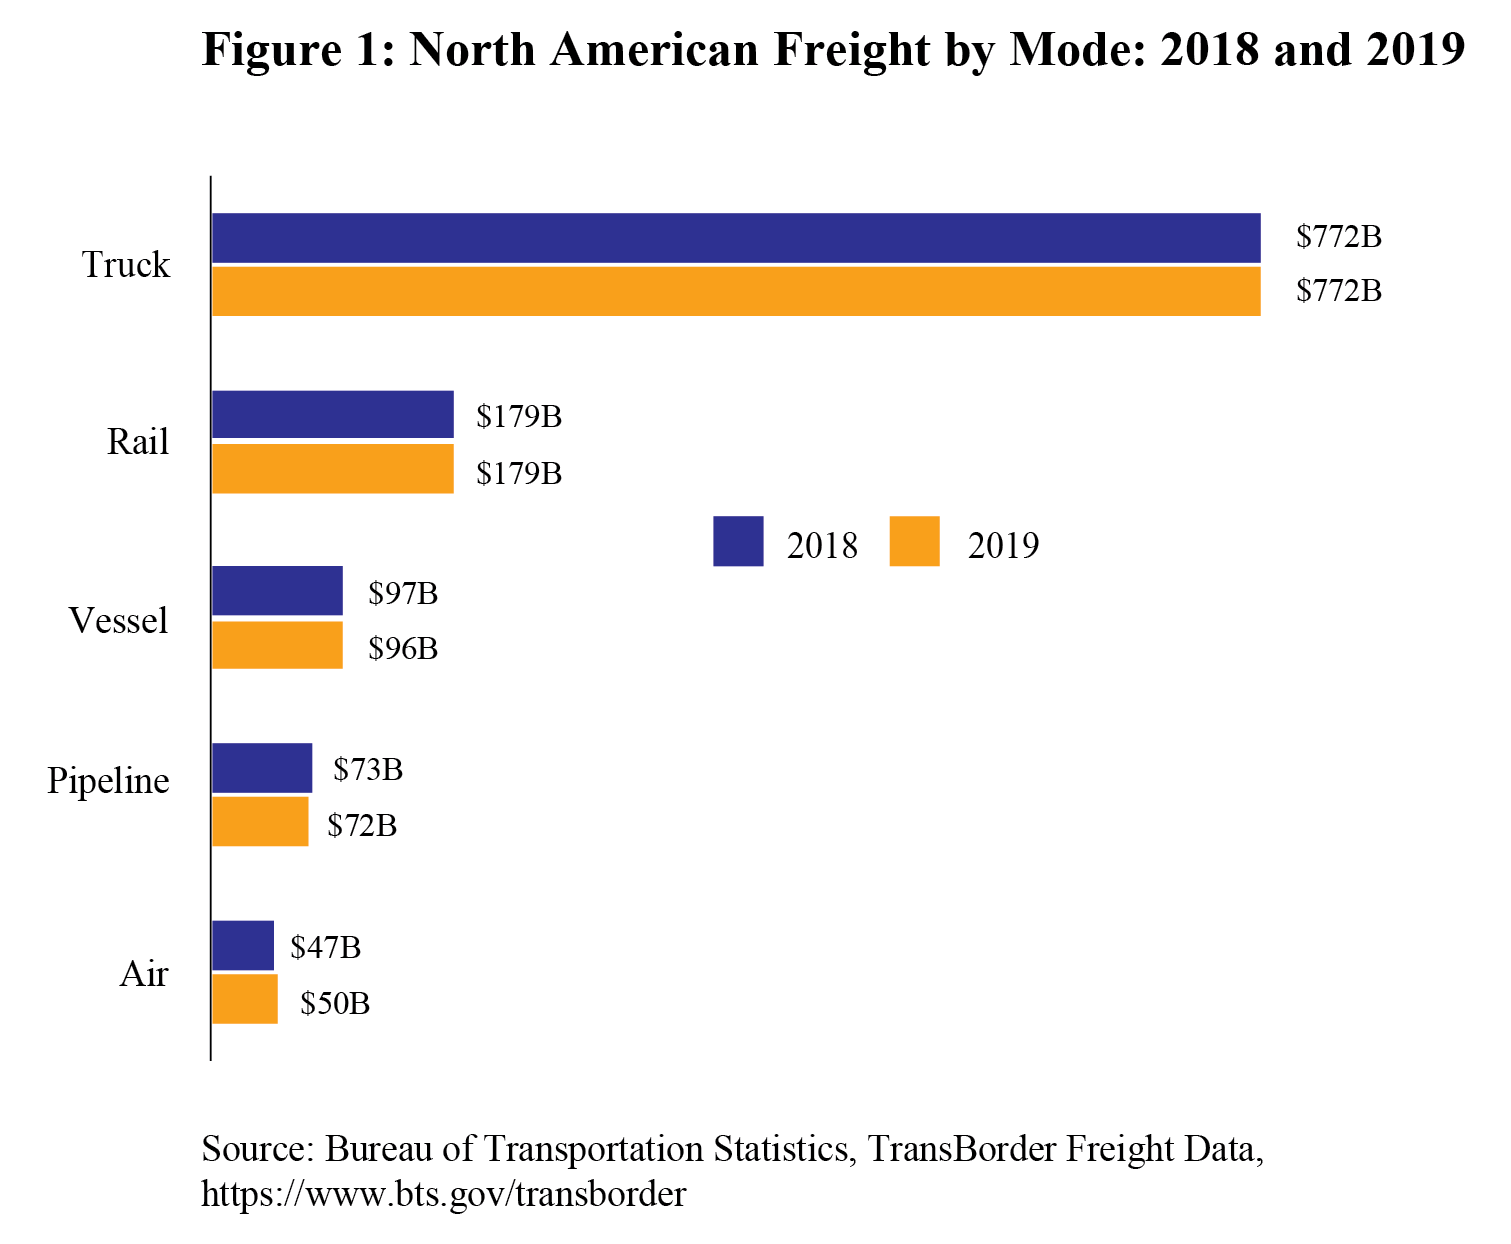
Monday, March 8, 2021 - 11:00am ET This release provides an annual summary of North American Transborder freight by mode. In the previous release, BTS reported that trucks were the most heavily utilized mode in 2019 for moving goods to and from both Canada and Mexico, carrying 63% of the freight transported. Trucks accounted for $772 billion of the $1.2 trillion in freight flows with Canada and Mexico in 2019. Rail accounted for $179 billion, almost 15%.
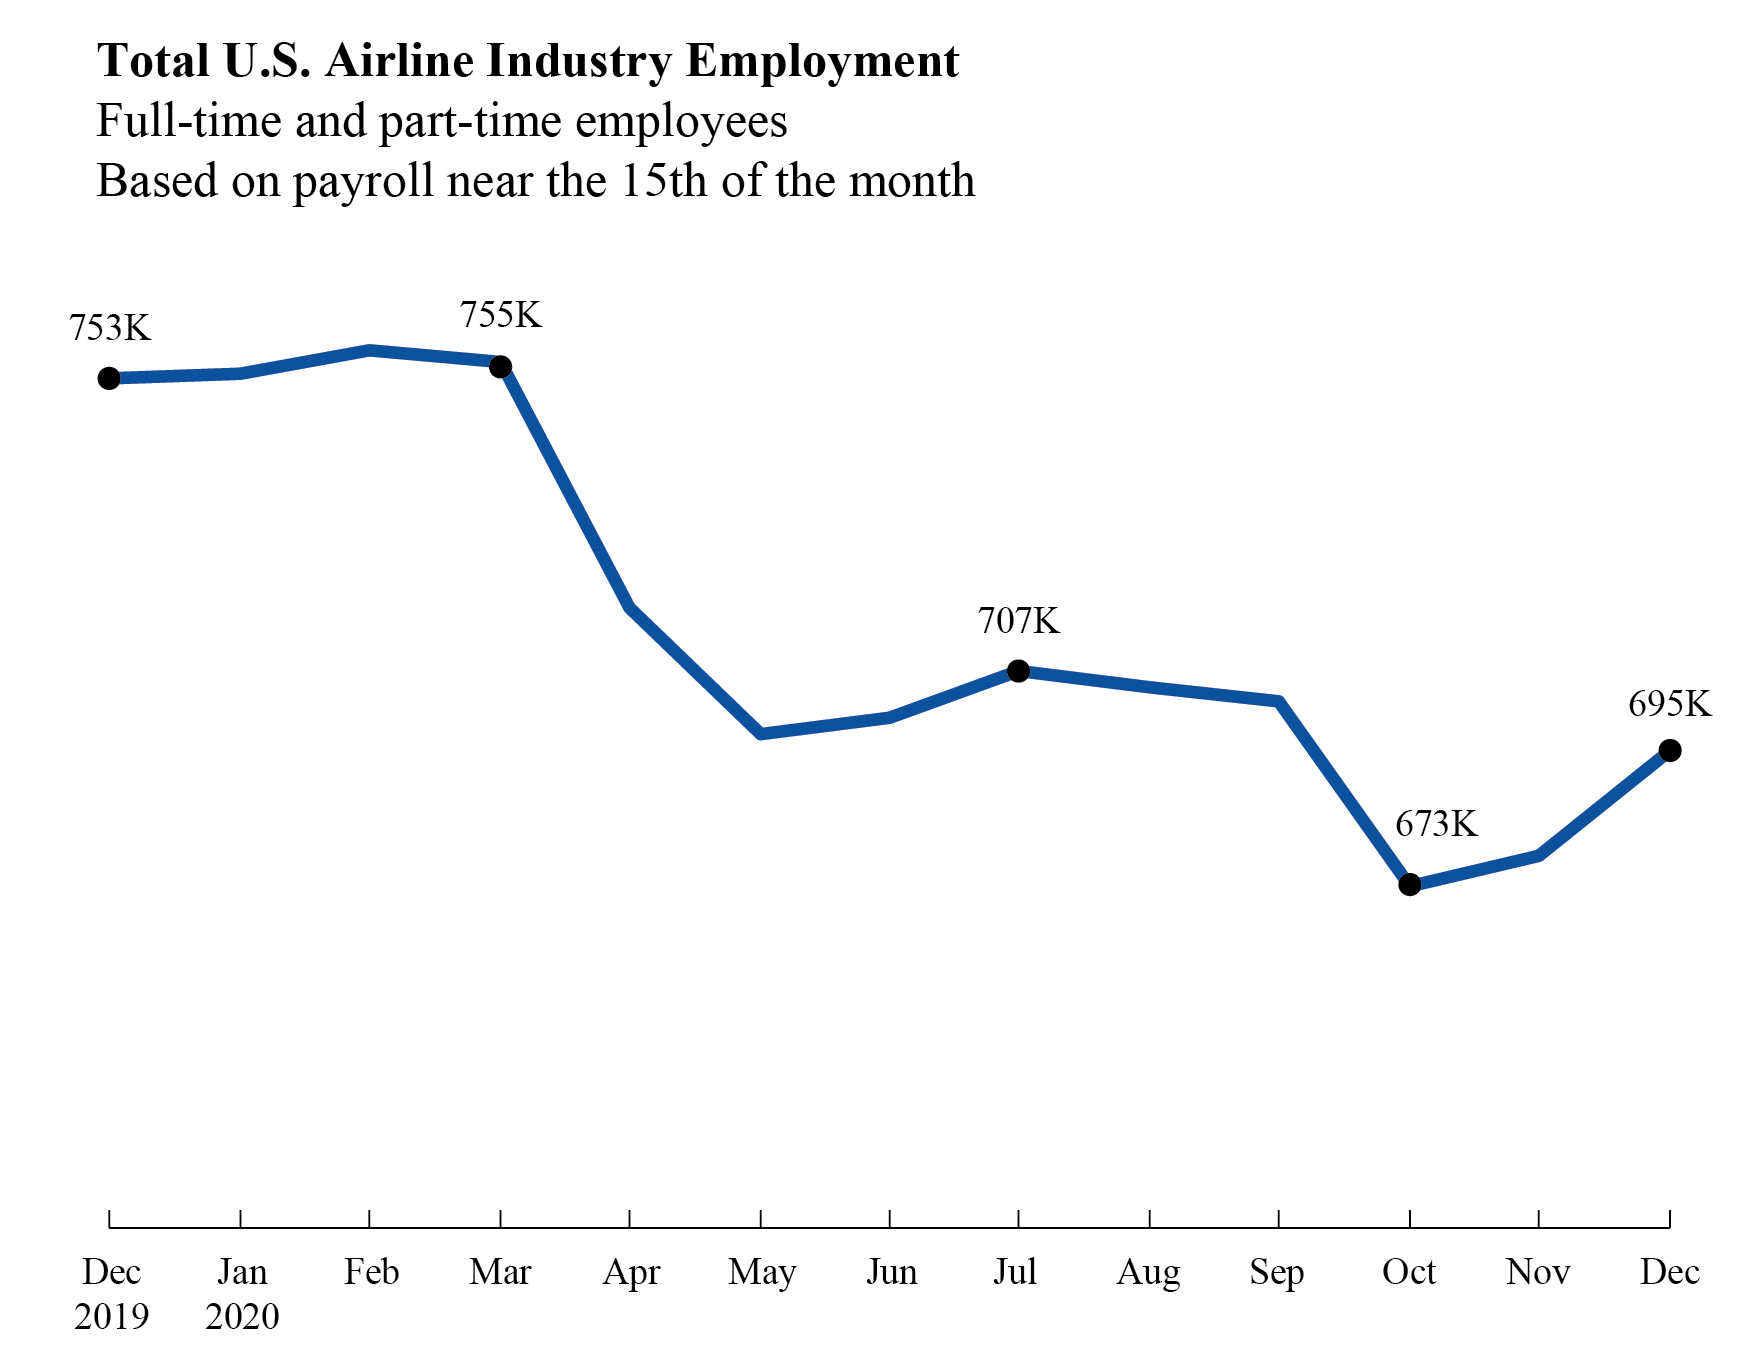
Tuesday, March 9, 2021 - 11:00am ET Previous release: U.S. airlines employed 694,638 workers in the middle of December 2020, 16,351 more than in mid-November 2020 but almost 60,000 fewer than in March 2020. The December total was the highest since September (702,068) before the expiration of the CARES Act which prohibited layoffs by airlines receiving funds. Total employment (full-time + part-time) by all U.S. airlines including scheduled passenger, charter and cargo: December 2019 752,565 November 2020 678,287 December 2020 694,638 Regulations require airlines to report employment numbers for a pay period near the 15th of the month. Monthly full-time and part-time employment statistics are reported by U.S. airlines that operate at least one aircraft that has more than 60 seats or the capacity to carry a payload of passengers, cargo and fuel weighing more than 18,000 pounds.
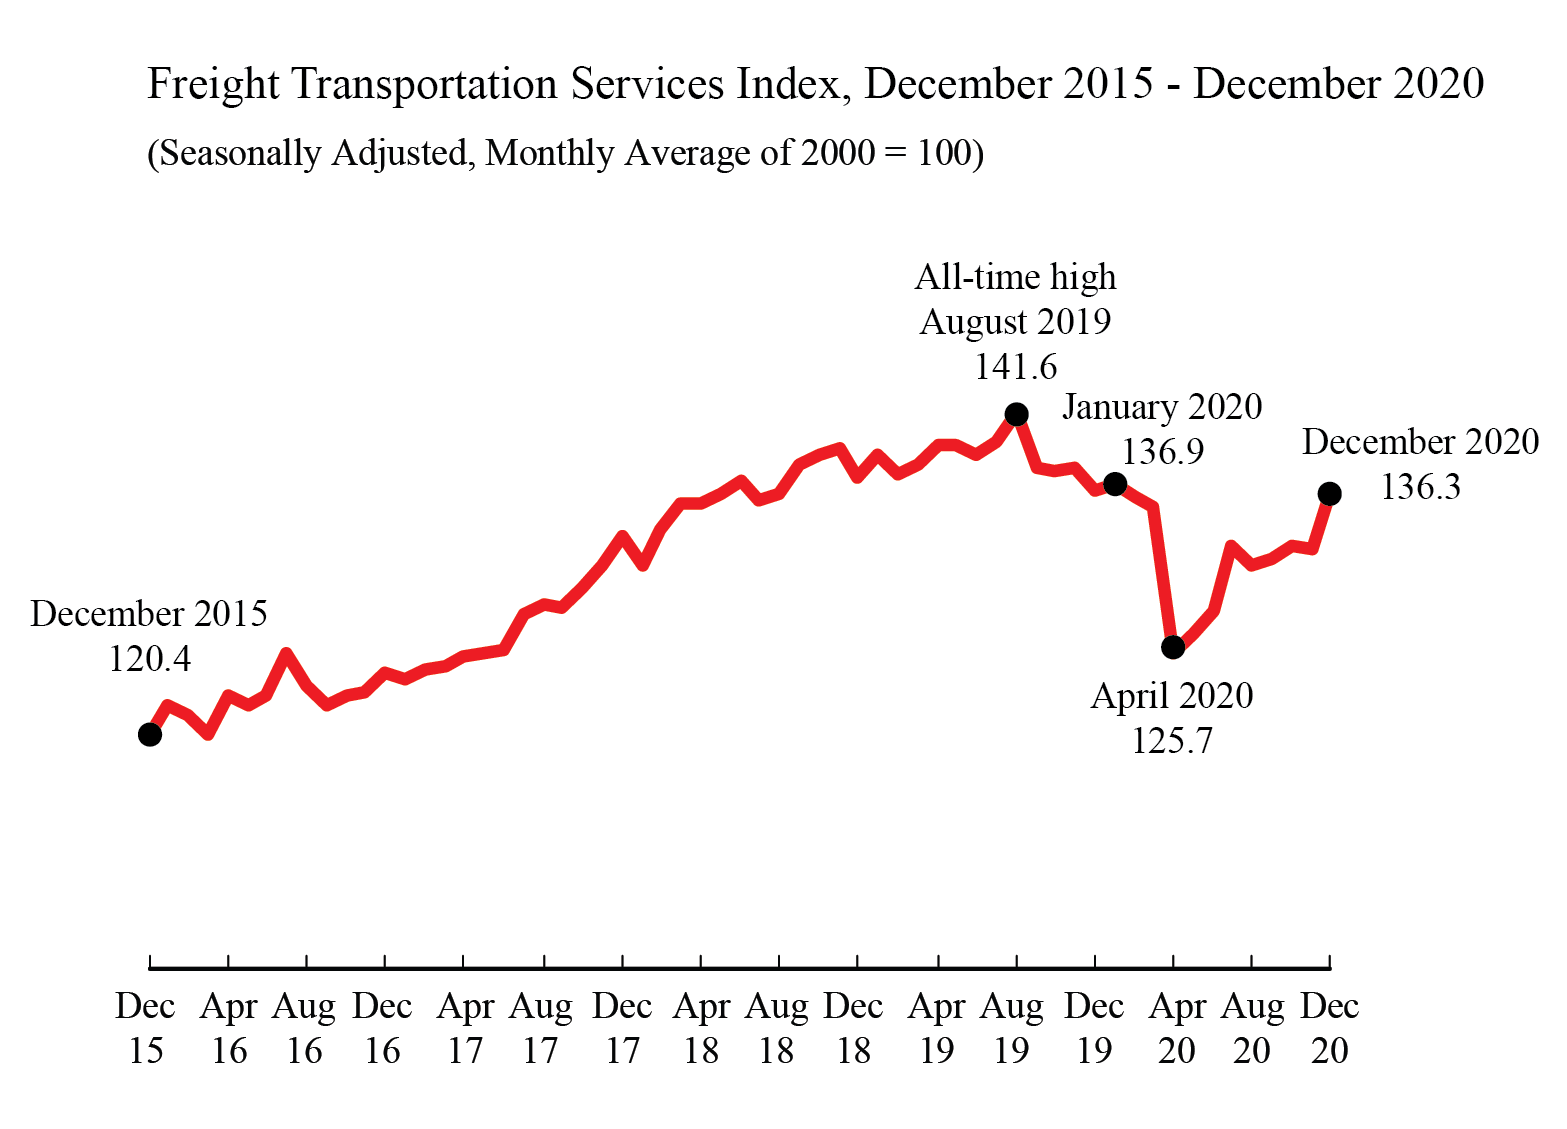
Wednesday, March 10, 2021 - 10:00am ET The Freight TSI measures the month-to-month changes in for-hire freight shipments by mode of transportation. In the previous release for December, the Freight TSI rose 2.7% in December from November, rising to the highest level since the start of the pandemic. Annually, from December 2019 to December 2020 the index fell 0.1% compared to a decline of 0.6% from December 2018 to December 2019 and a rise of 2.9% from December 2017 to December 2018.
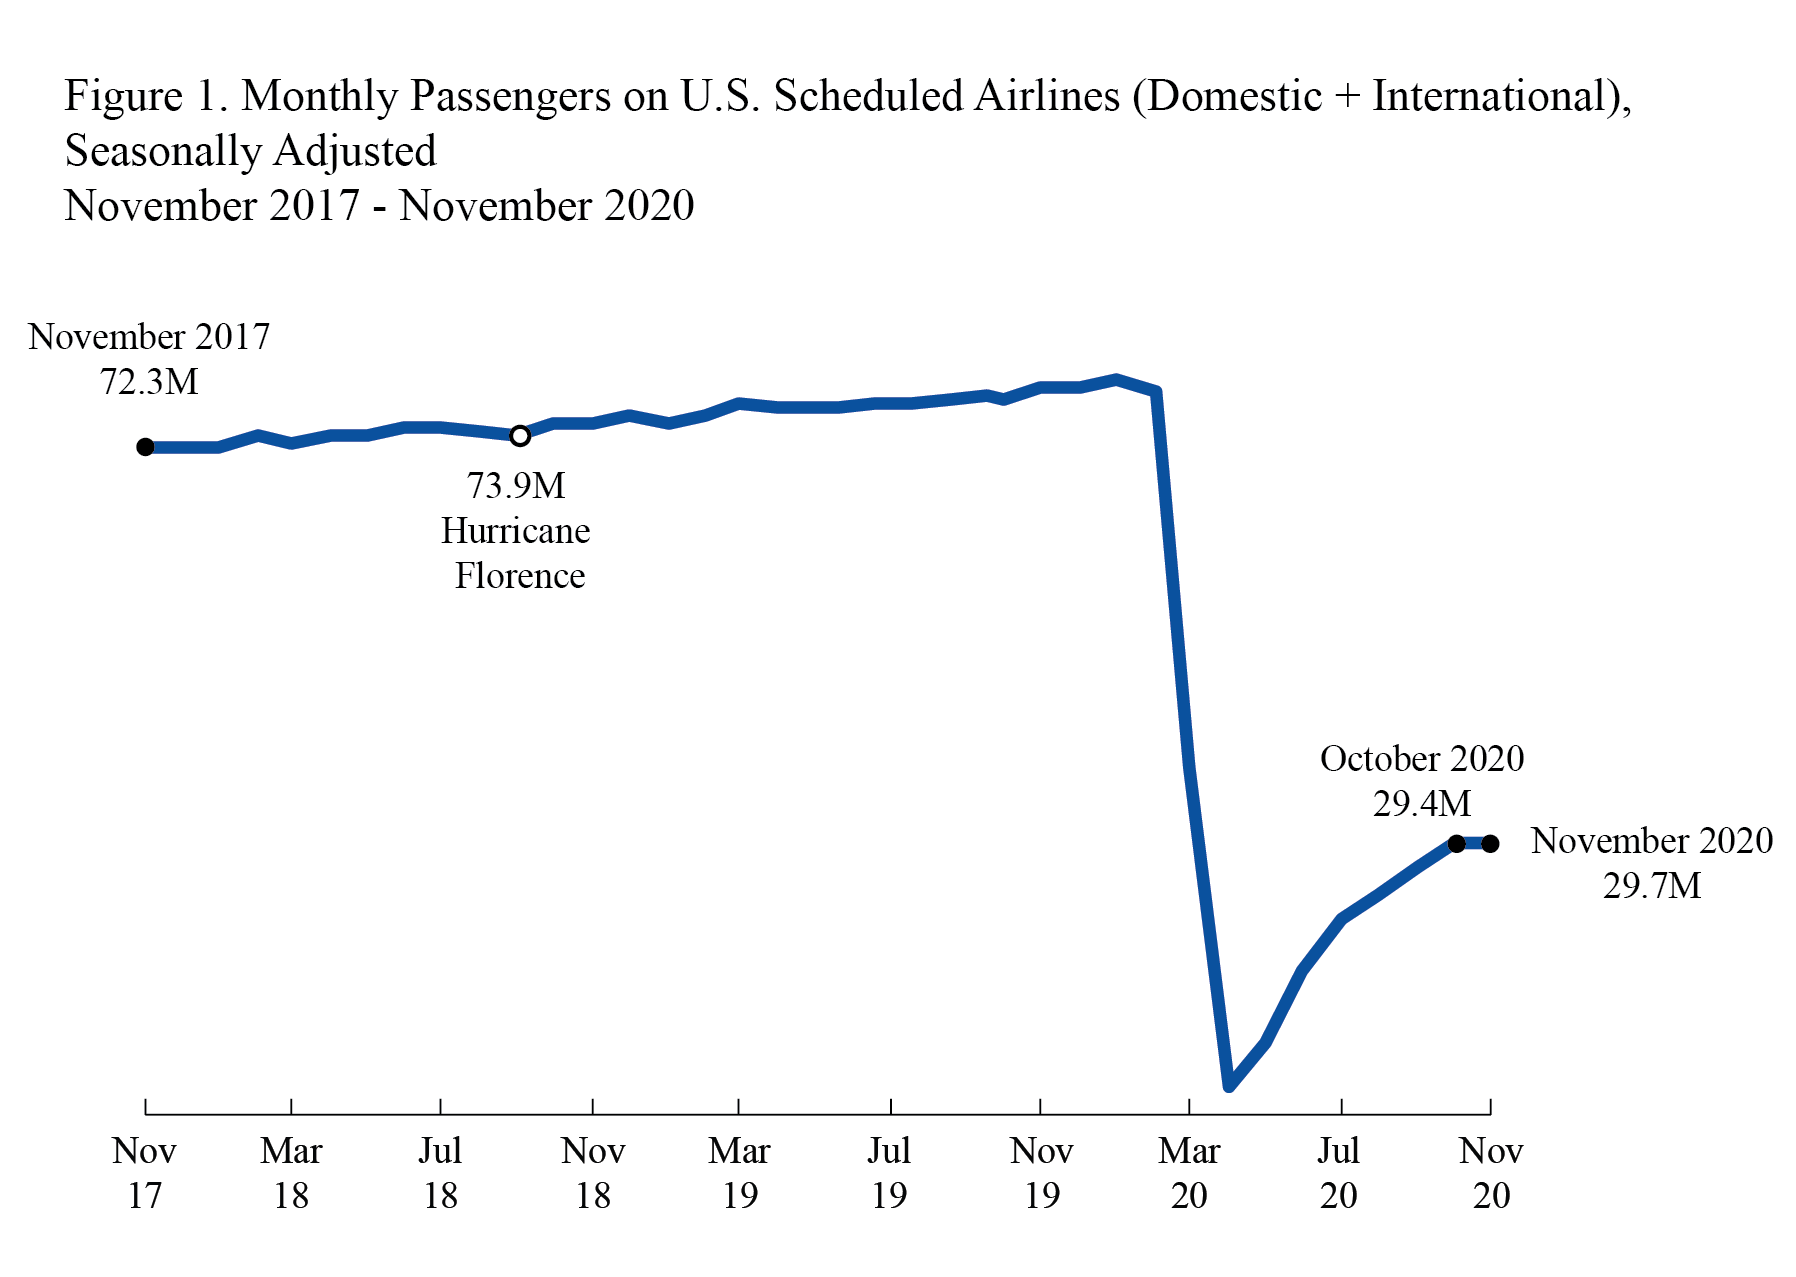
Thursday, March 11, 2021 - 11:00am ET BTS release of reported airline data through December and international data through September. Data are for U.S. airlines monthly passengers, revenue passenger-miles, available seat-miles and load factor for systemwide, domestic and international. Numbers are seasonally-adjusted and unadjusted. In the previous release, U.S. airlines carried 29.7 million systemwide (domestic and international) scheduled service passengers in November 2020, seasonally adjusted, up 1.1% from October. There were 26.9 million domestic passengers and 2.9 million international passengers on U.S. airlines flights in November.
BTS Previously
BTS has released the following:
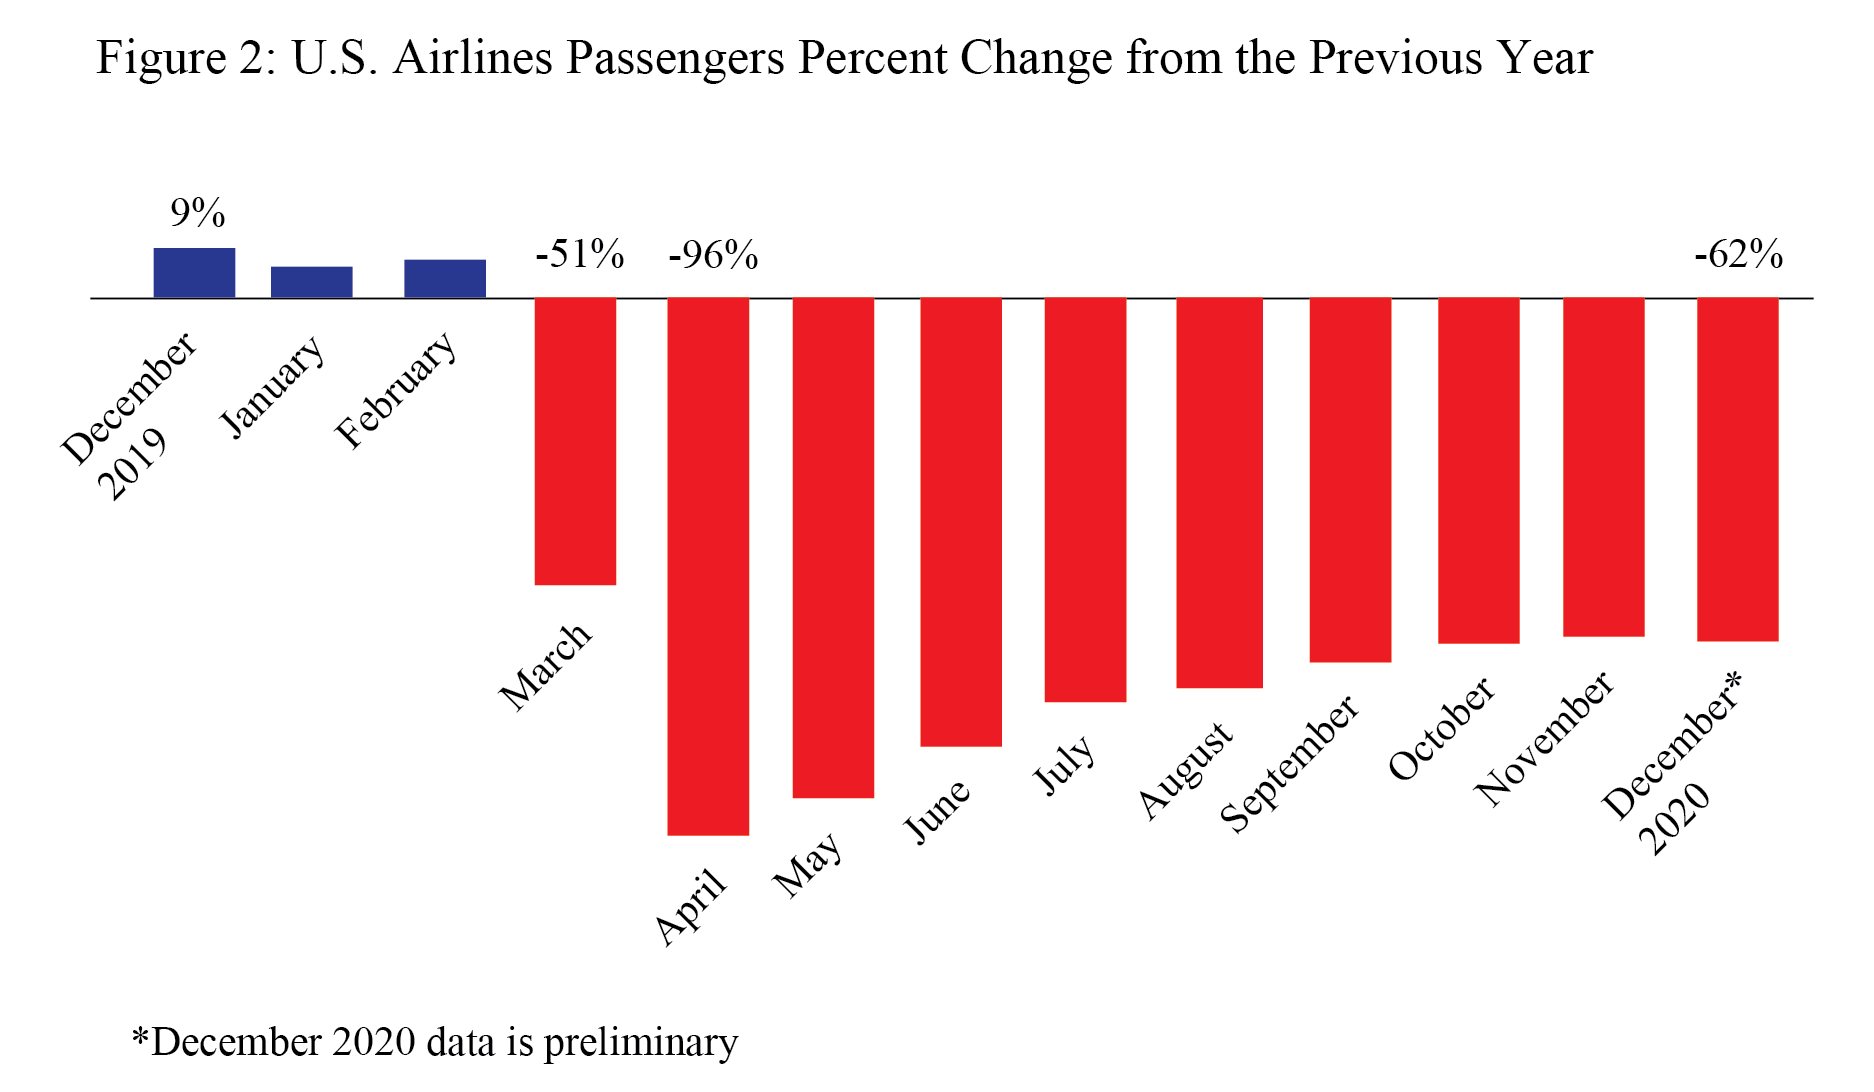
Released February 16 U.S. airlines carried 62% fewer scheduled service passengers in December 2020 than in December 2019, according to data filed with the Bureau of Transportation Statistics (BTS) by 22 airlines that carry more than 90% of the passengers. The 62% decline from December 2019 was slightly larger than the 61% year-to-year decline from November 2019 to November 2020.
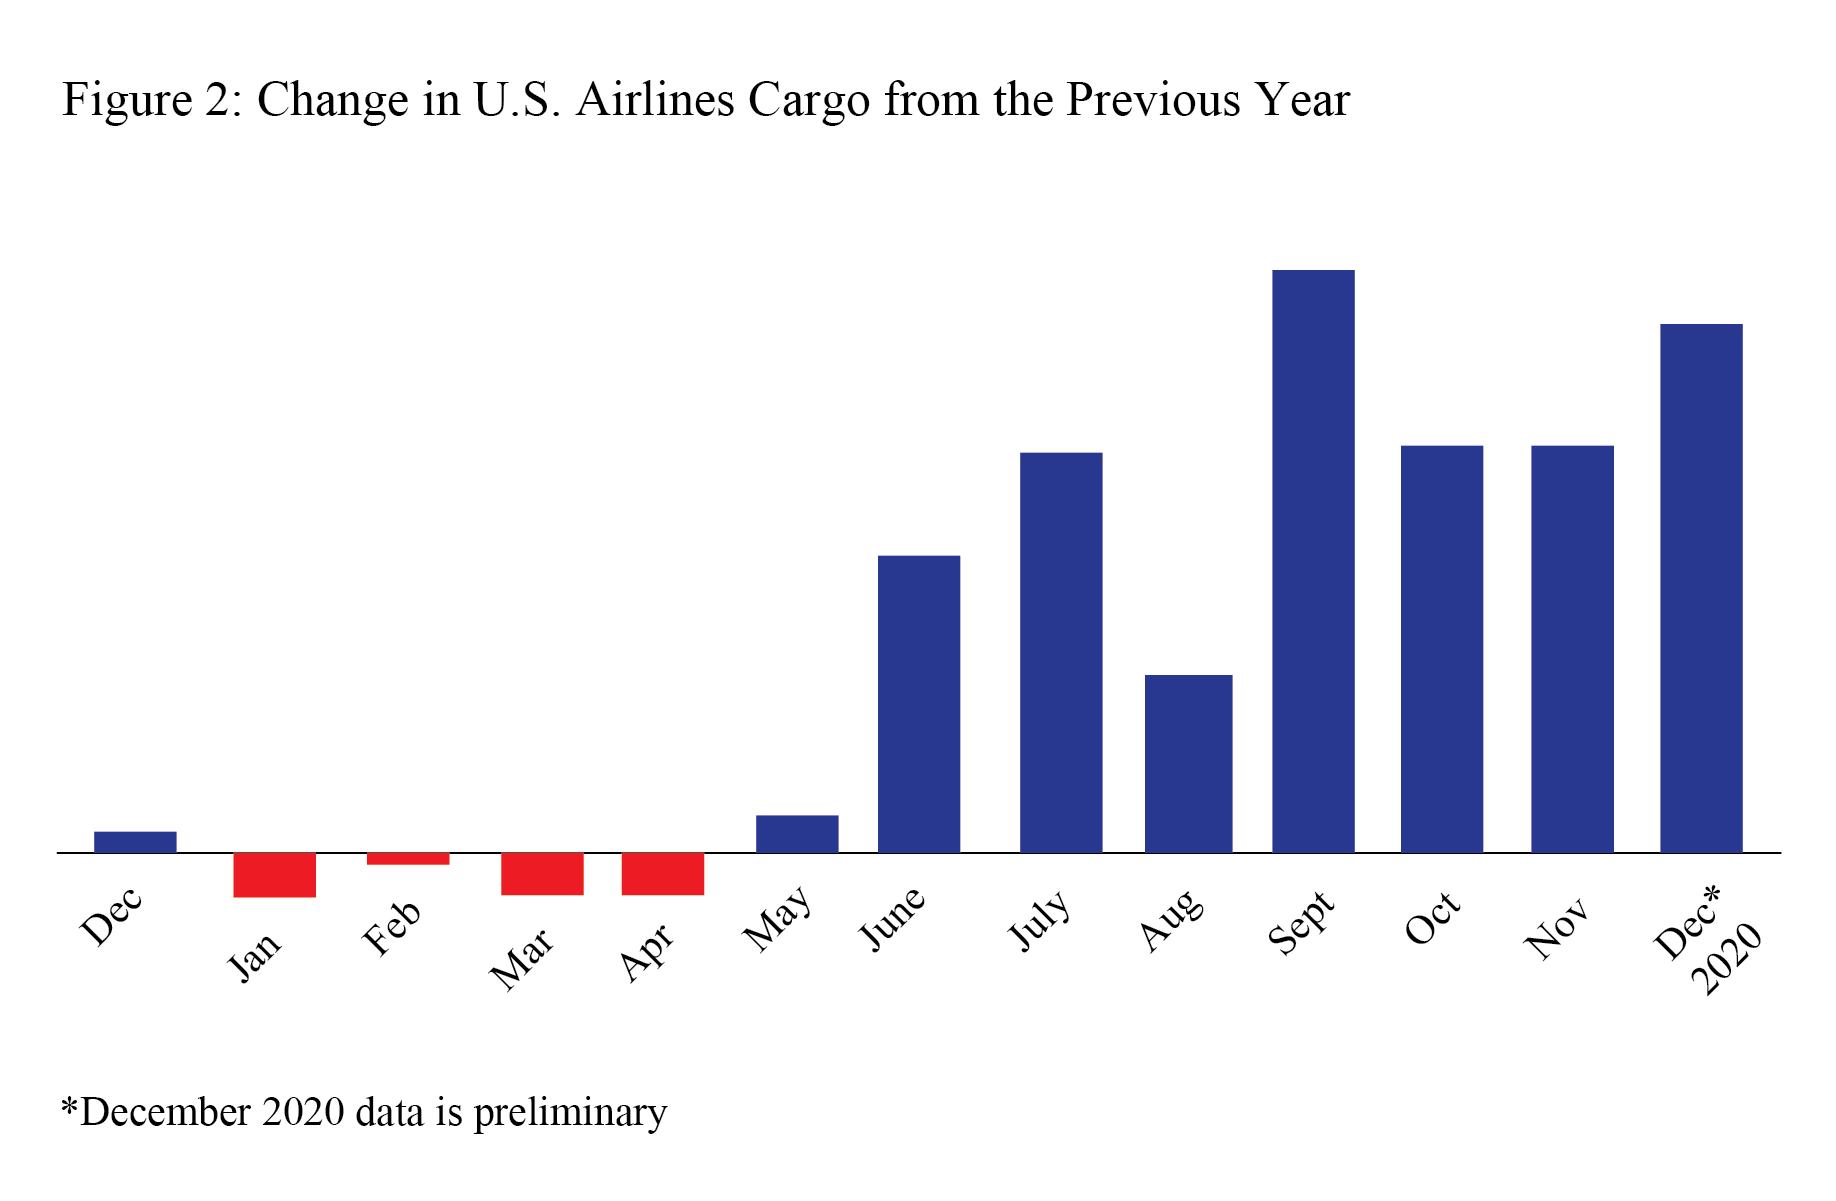
Released February 17 U.S. airlines carried 17% more cargo by weight in December 2020 (preliminary) than in December 2019. The rise was fueled by gains of 16% in domestic cargo and 20% in international cargo, according to data filed by 15 of the leading cargo airlines. The 15 airlines carry 95% of the total cargo by weight on U.S. airlines. Cargo data consists of freight and mail carried within the U.S. and between the U.S. and foreign points. For the pandemic period of May 2020 through December 2020, U.S. airlines carried 1,339 thousand more tons of cargo than in the same period in 2019, up 11%. They carried 13% more domestic cargo and 6% more international cargo. For the full year 2020, U.S. airlines carried 1,276 thousand more tons of cargo than in 2019, up 7%. They carried 10% more domestic cargo and less than 1% more international cargo.
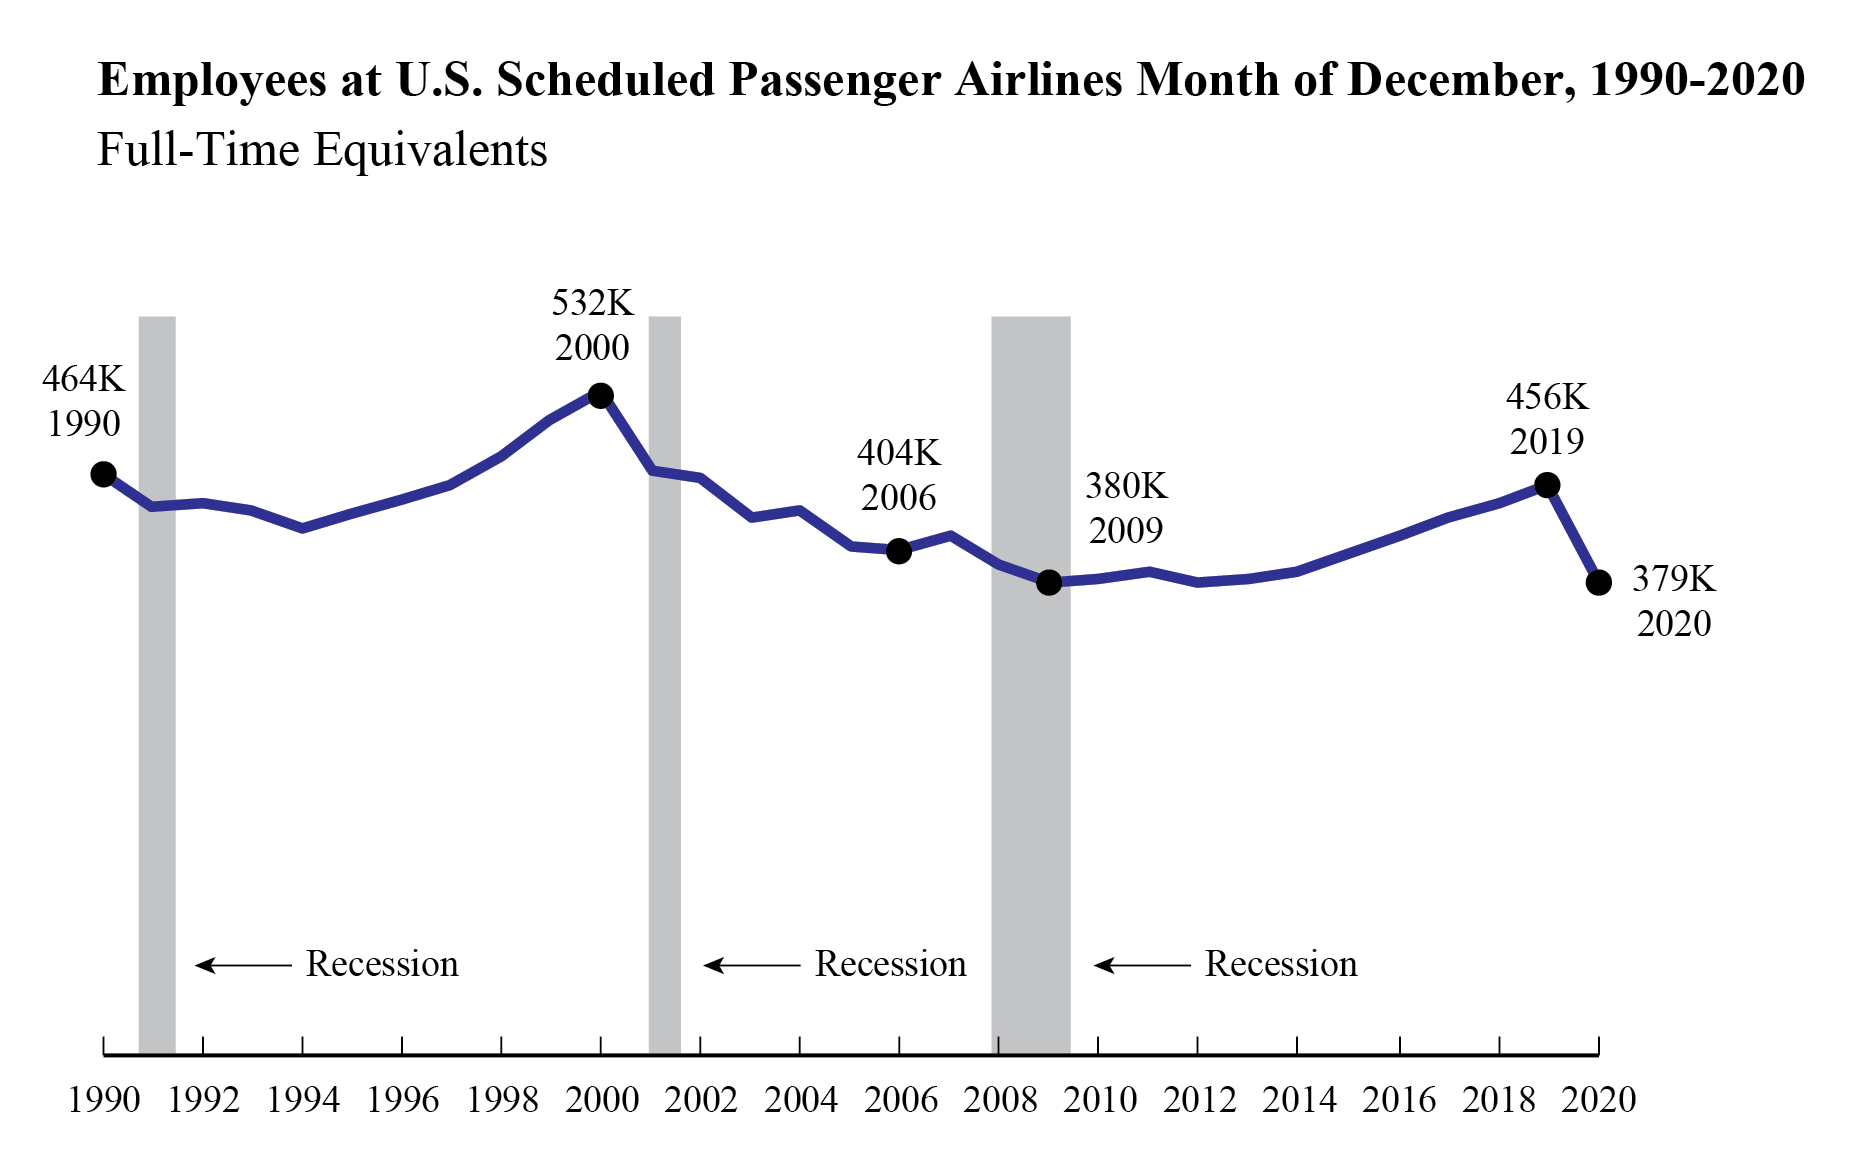
Released February 18 BTS reported that 20 U.S. scheduled passenger airlines employed 3.4% more full-time equivalents (FTEs) in mid-December 2020 than in mid-November 2020.
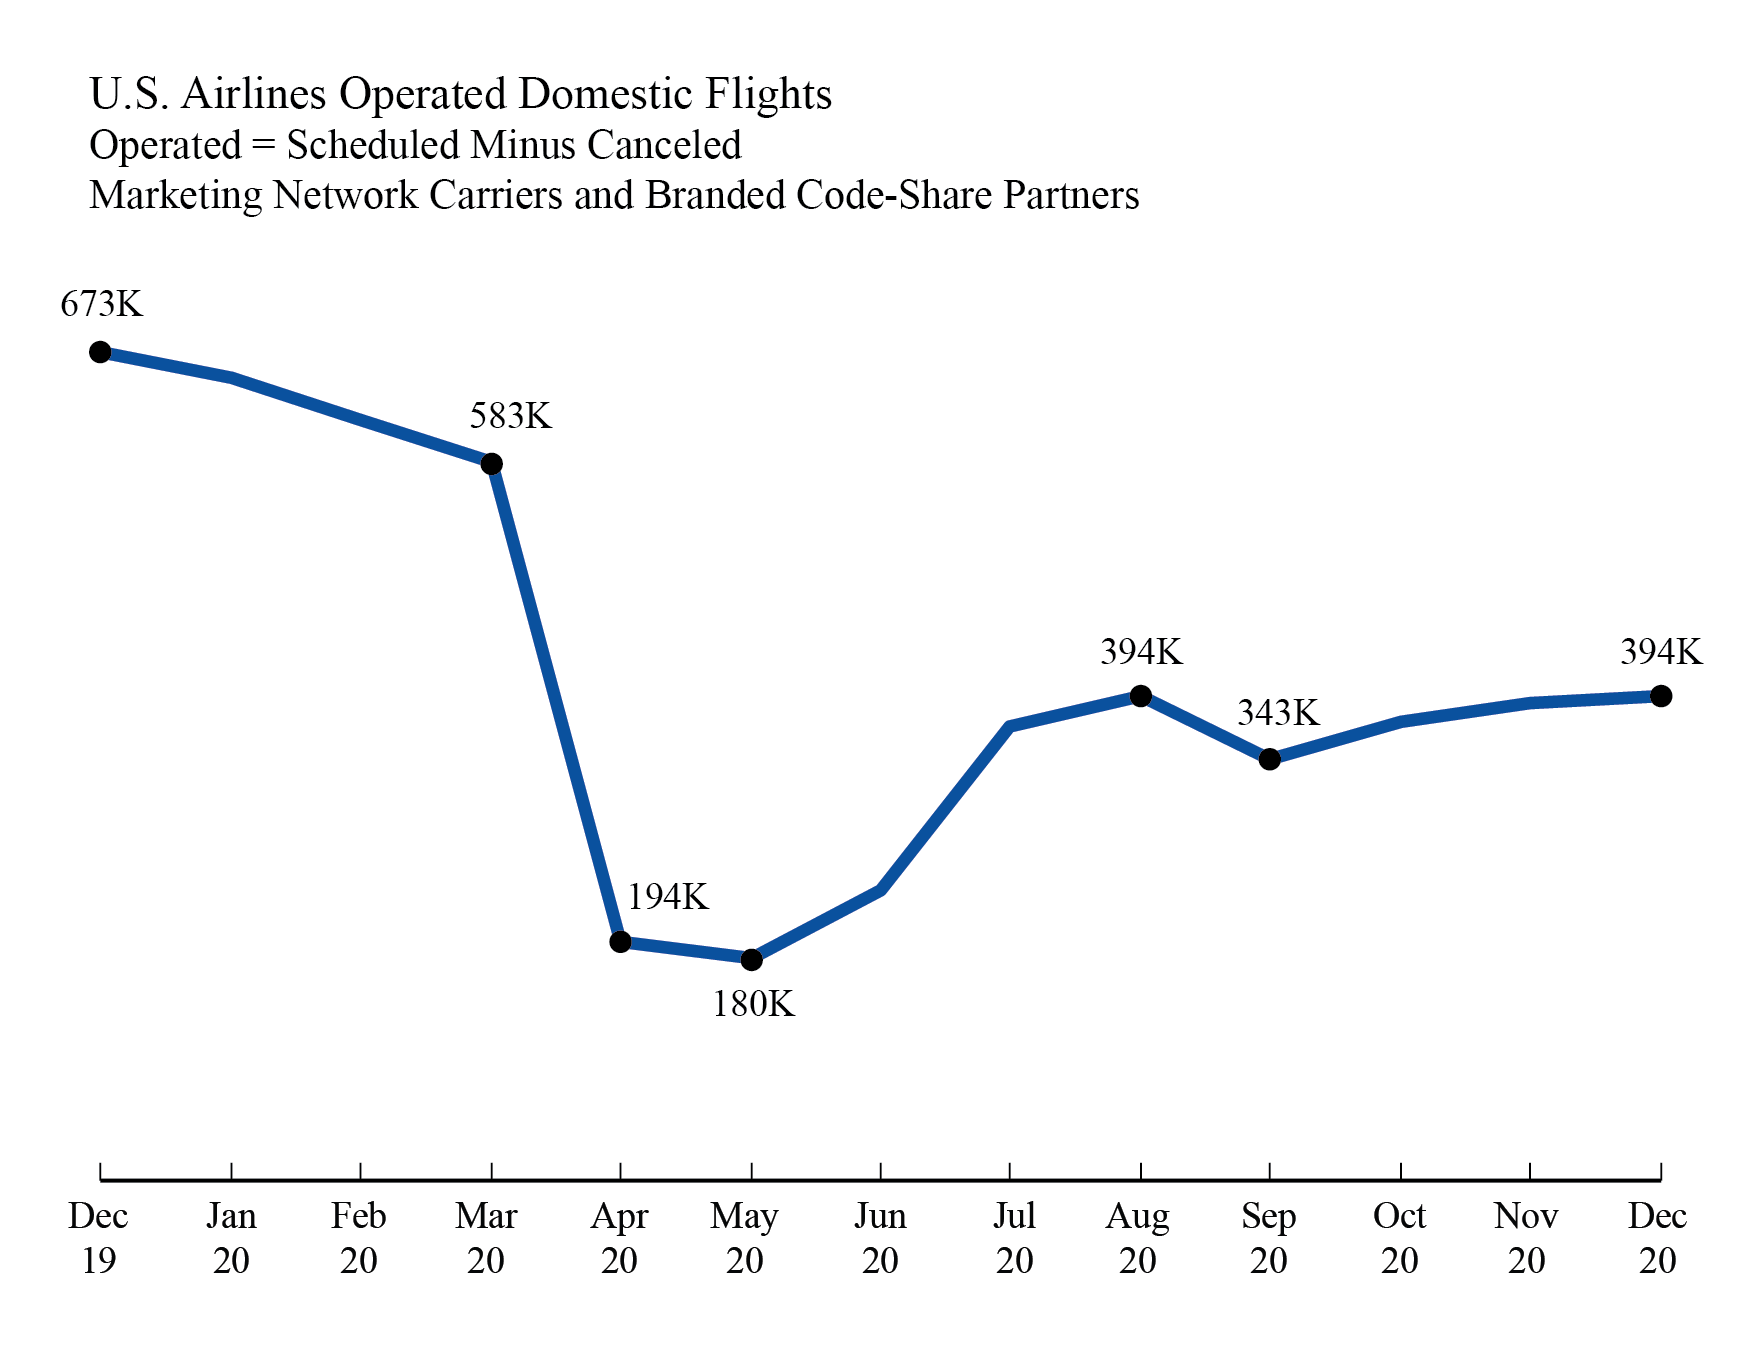
Released February 25 The 10 marketing network carriers reported 397,802 scheduled domestic flights in December 2020 compared to 389,587 flights in November 2020 and 679, 941 flights in December 2019. Of those 397,802 scheduled flights, 1.1%, 4,253 flights, were canceled. As a result of schedule reductions and cancellations, the carriers reported operating 393,549 flights in December 2020, compared to 387,481 flights in November 2020 and the all-time monthly low of 180,151 flights in May 2020. Airlines operated 672,725 flights in December 2019. For the full year 2020, airlines operated 4,721,342 flights compared to 7,938,055 flights in full year 2019. The marketing carriers include branded code-share partners of mainline carriers.
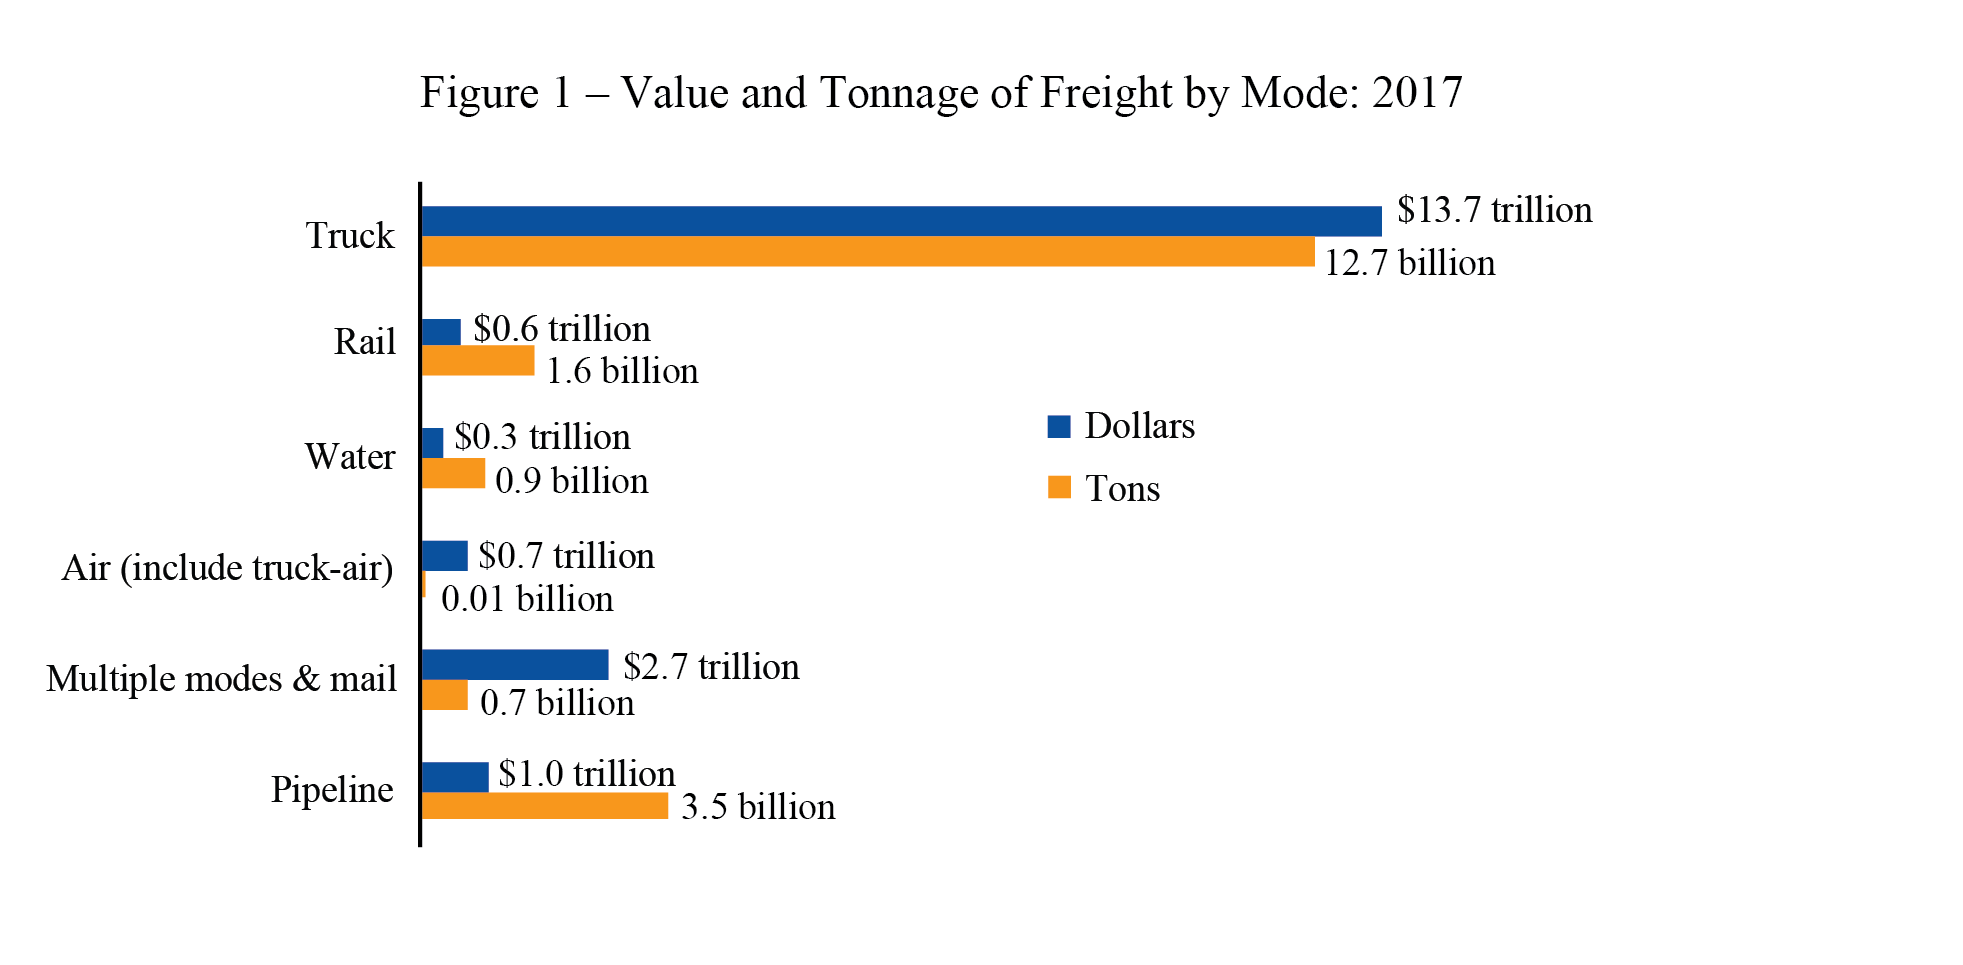
Released February 26 The Freight Analysis Framework (FAF5), the most comprehensive publicly available dataset of freight movement. FAF benchmarks are released at five-year intervals. Starting with data from BTS' Commodity Flow Survey (CFS) and international trade data from the Census Bureau, FAF incorporates data from agriculture, extraction, utility, construction, service, and other sectors. The most recent CFS data were collected in 2017 which is the benchmark year for FAF5. FAF numbers in this release represent total freight flows within the U.S. including domestic movement of imports and exports.
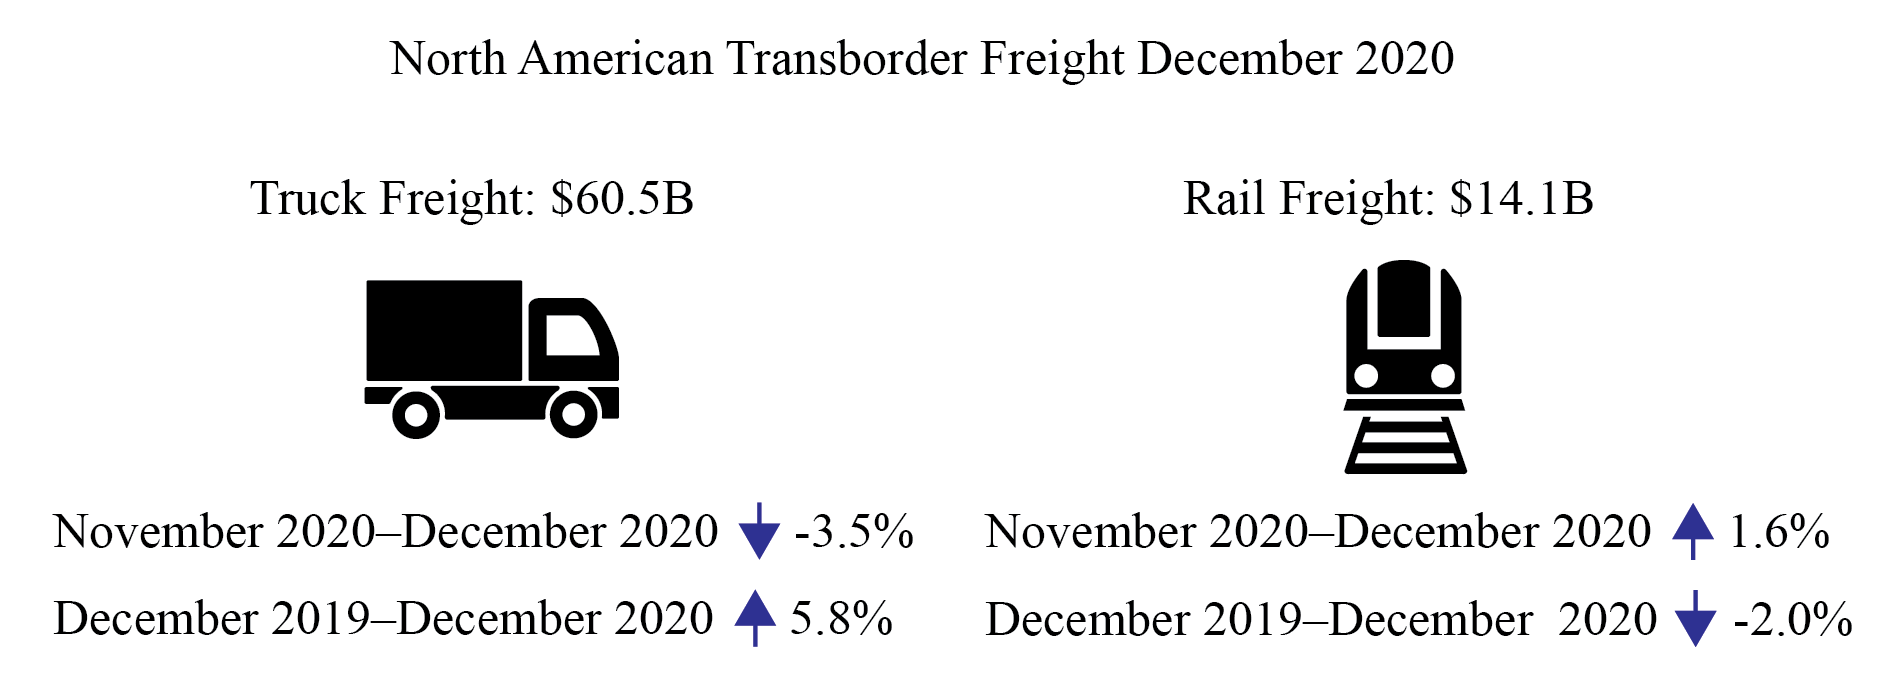
Released Feb. 26 Freight between the U.S. and other North American countries (Canada and Mexico) in December 2020:
BTS Contact: Dave Smallen 202-366-5568
| ||||||||||||||||||
BTS 2-Week Outlook: Bureau of Transportation Statistics Upcoming Releases March 1 - 12


Can Subliminal Messaging Help You Lose Weight?
| |||||||||||||||||||||||||||||||||||||||||||||||||||||||||||||||||


Subscribe to:
Posts (Atom)