| |||||||||||||||||||||||||||||||||||||||||||||||||||||||||||
COVID-19 Caution: Even With Vaccines, It May Be Too Early to Have Small Gatherings Again


BTS 2-Week Outlook: Bureau of Transportation Statistics Upcoming Releases February 1 - 12
BTS 2-Week Outlook Bureau of Transportation Statistics Upcoming Releases February 1 - 12 Upcoming from February 1
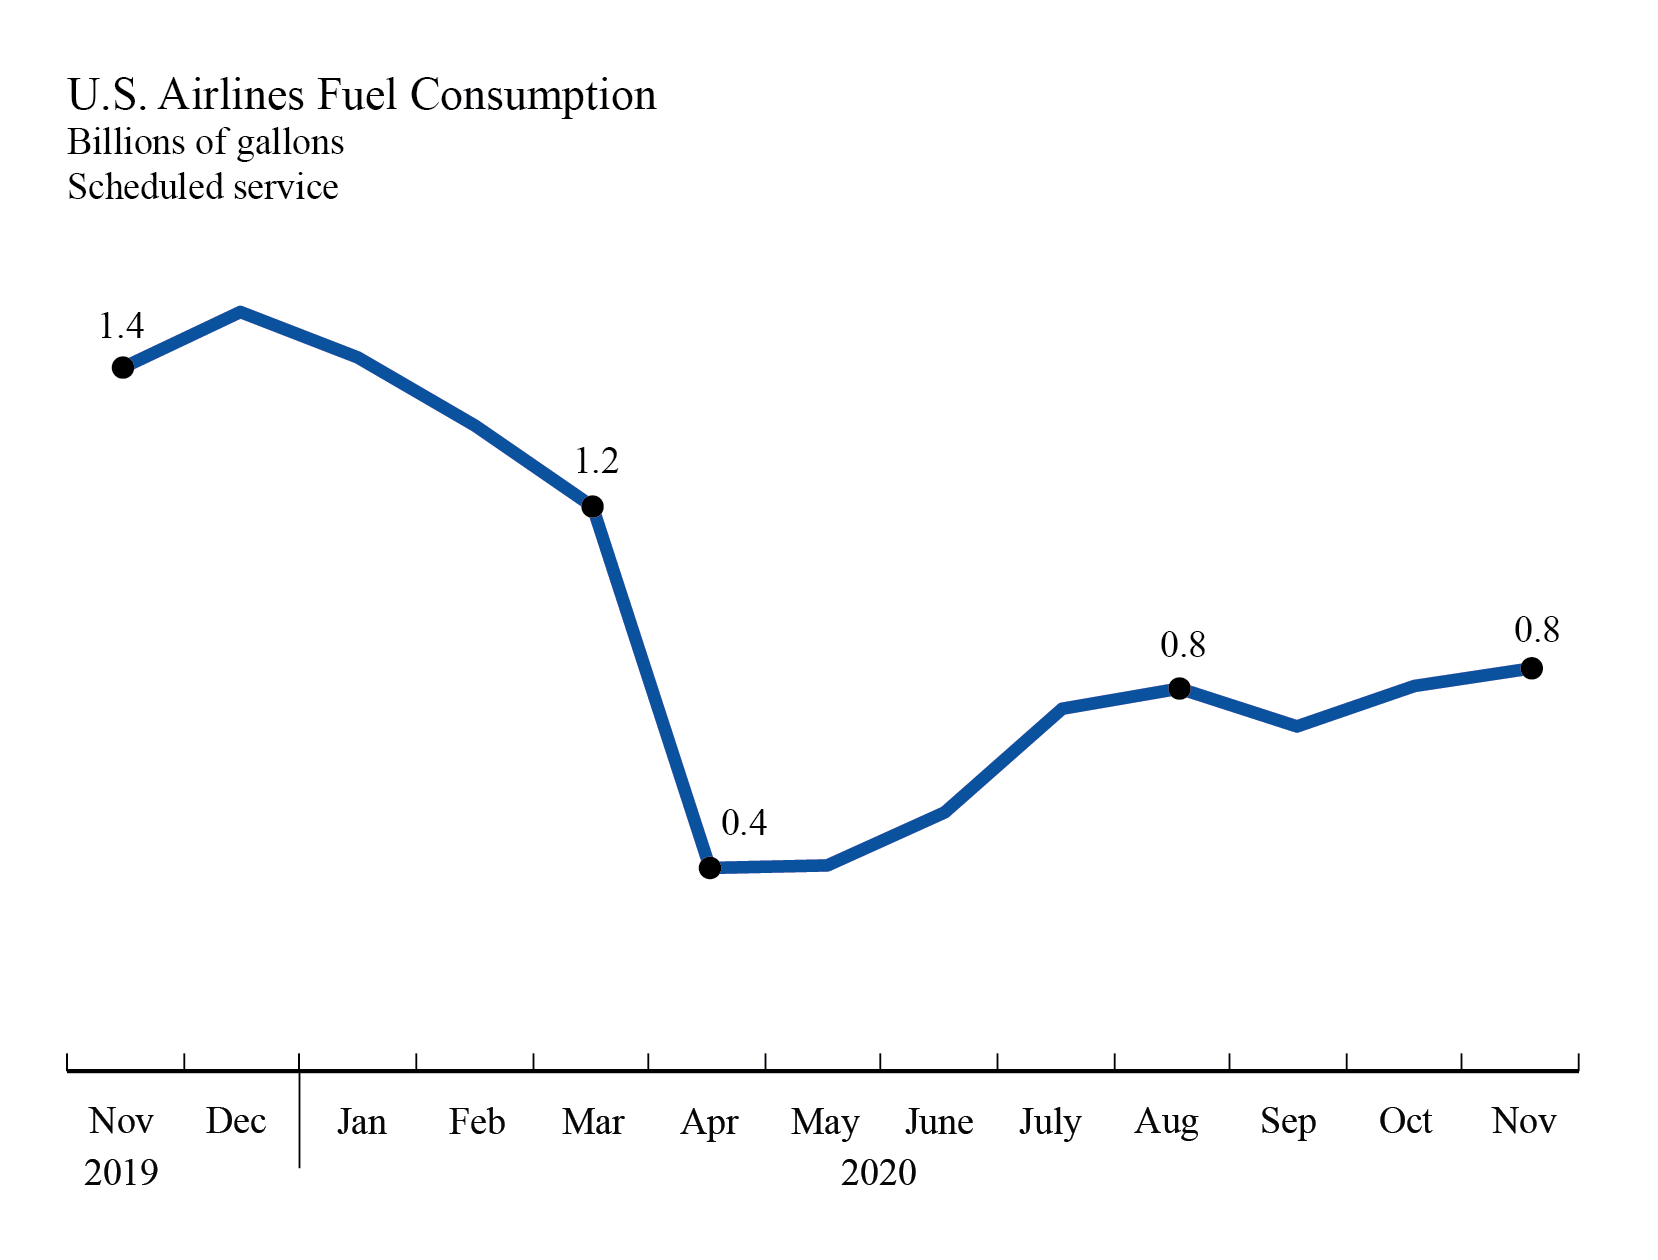
Wednesday, February 3, 2021 - 11:00am ET Airline Fuel Cost and Consumption, December 2020
Tuesday, February 9, 2021 - 11:00am ET Airline Full-Time/Part-Time Employment, December 2020
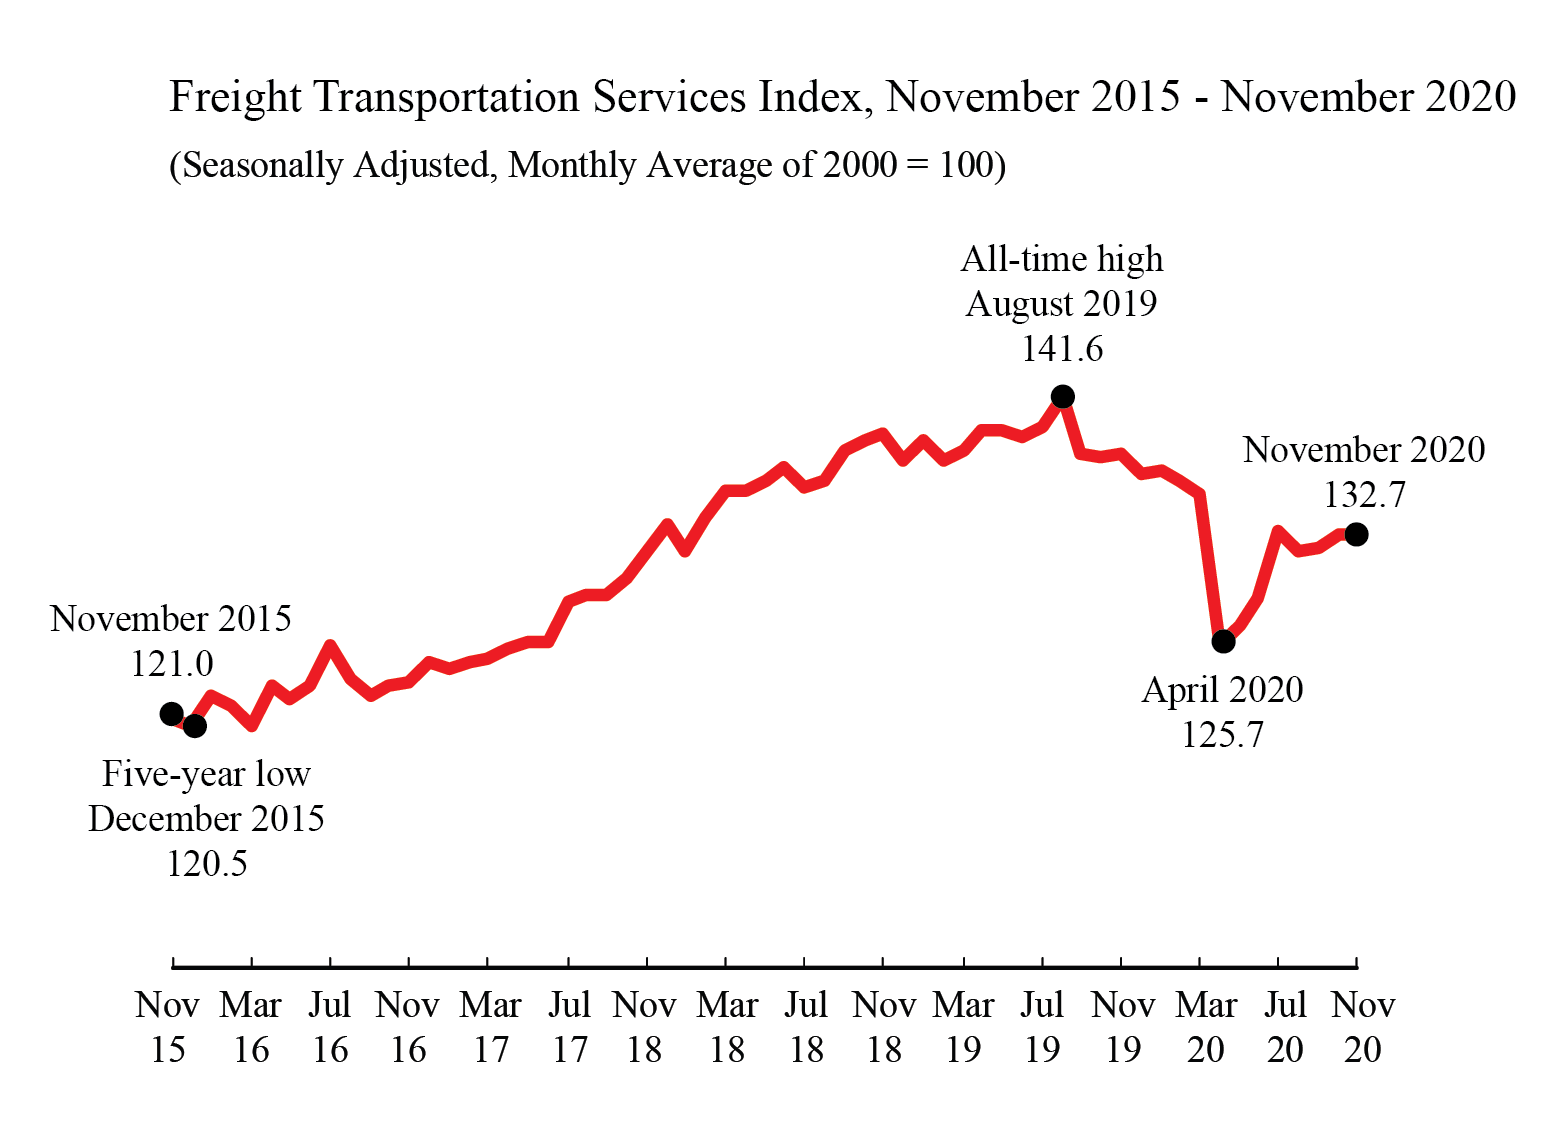
Wednesday, February 10, 2021 - 10:00am ET Transportation Services Index, December 2020
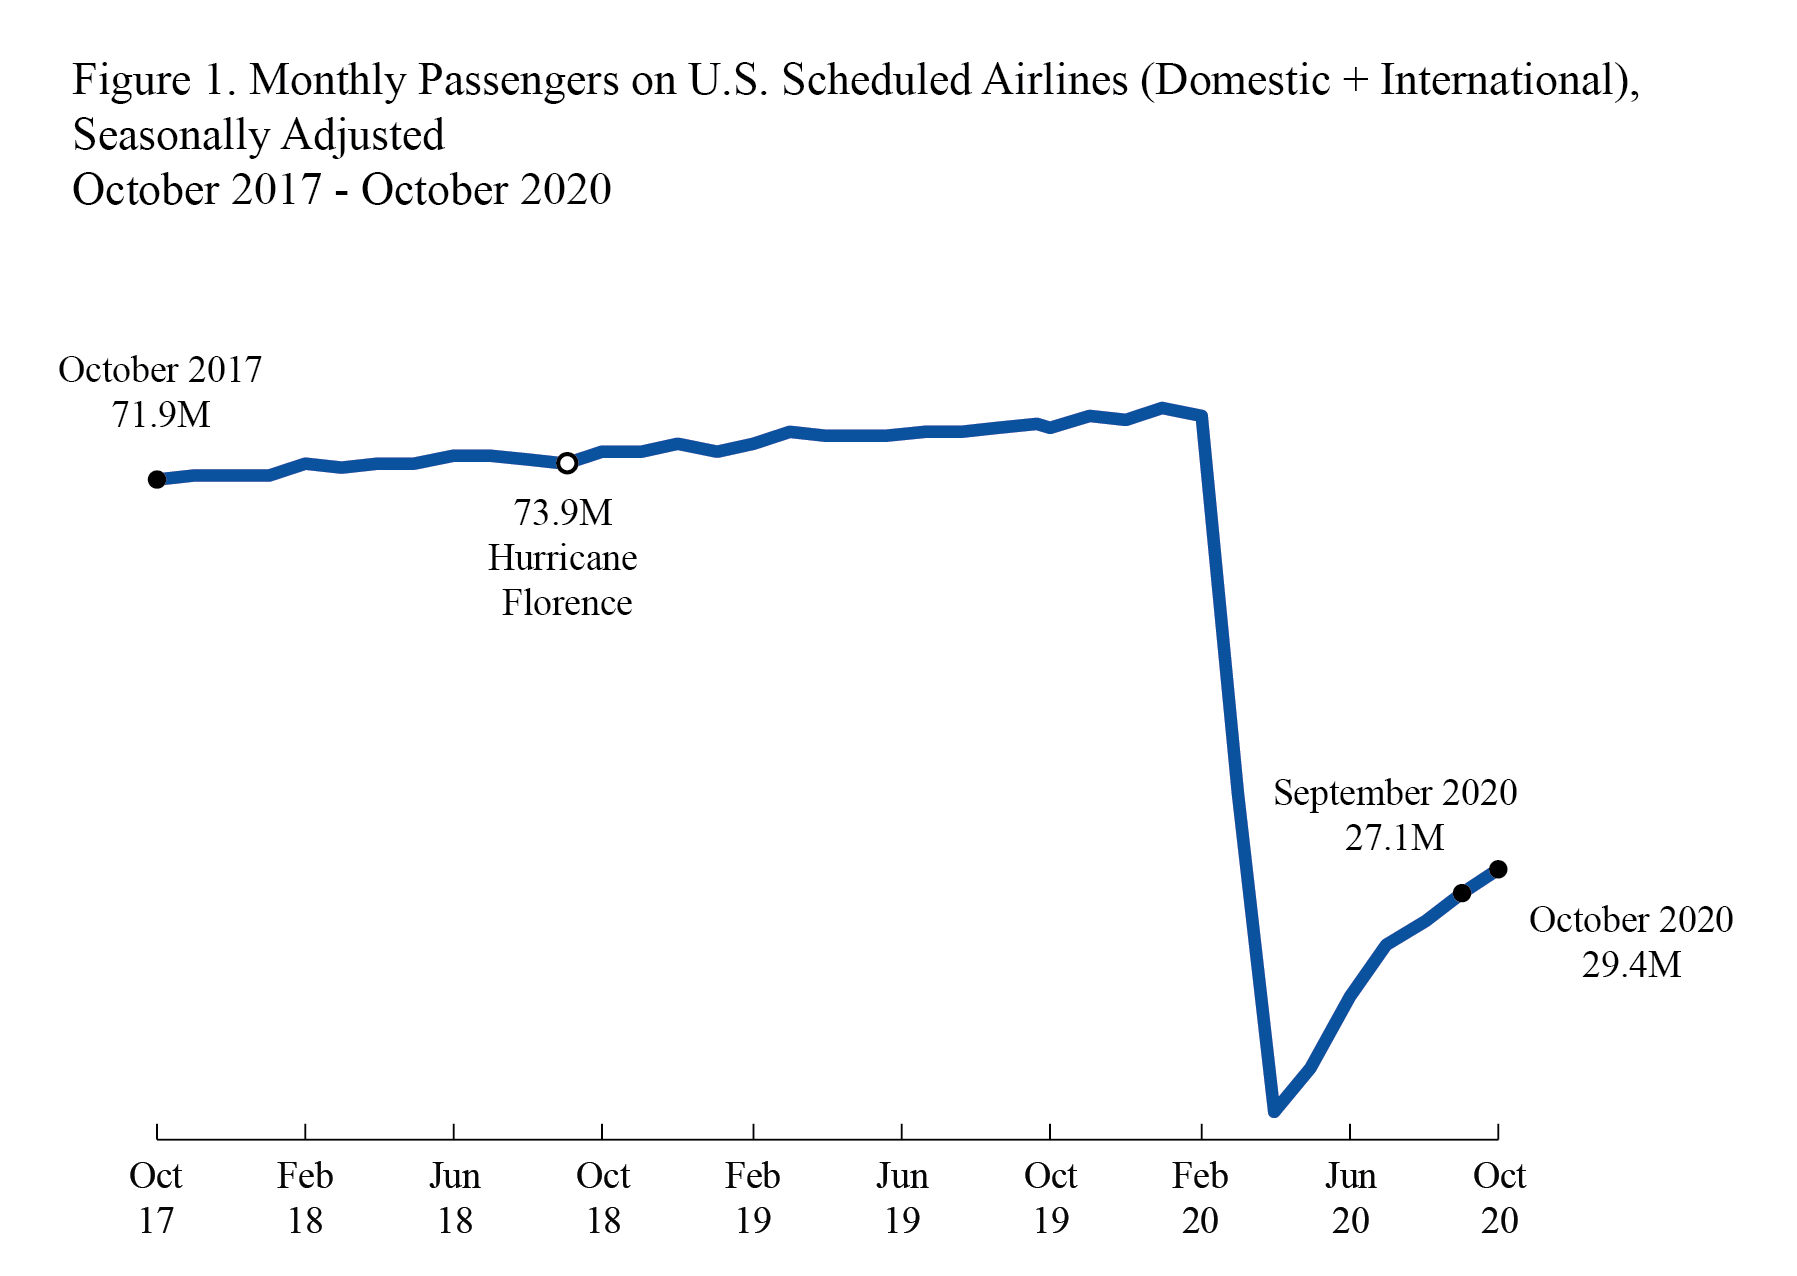
Thursday, February 11, 2021 - 11:00am ET Airline Traffic Data, November 2020 Domestic, August 2020 International
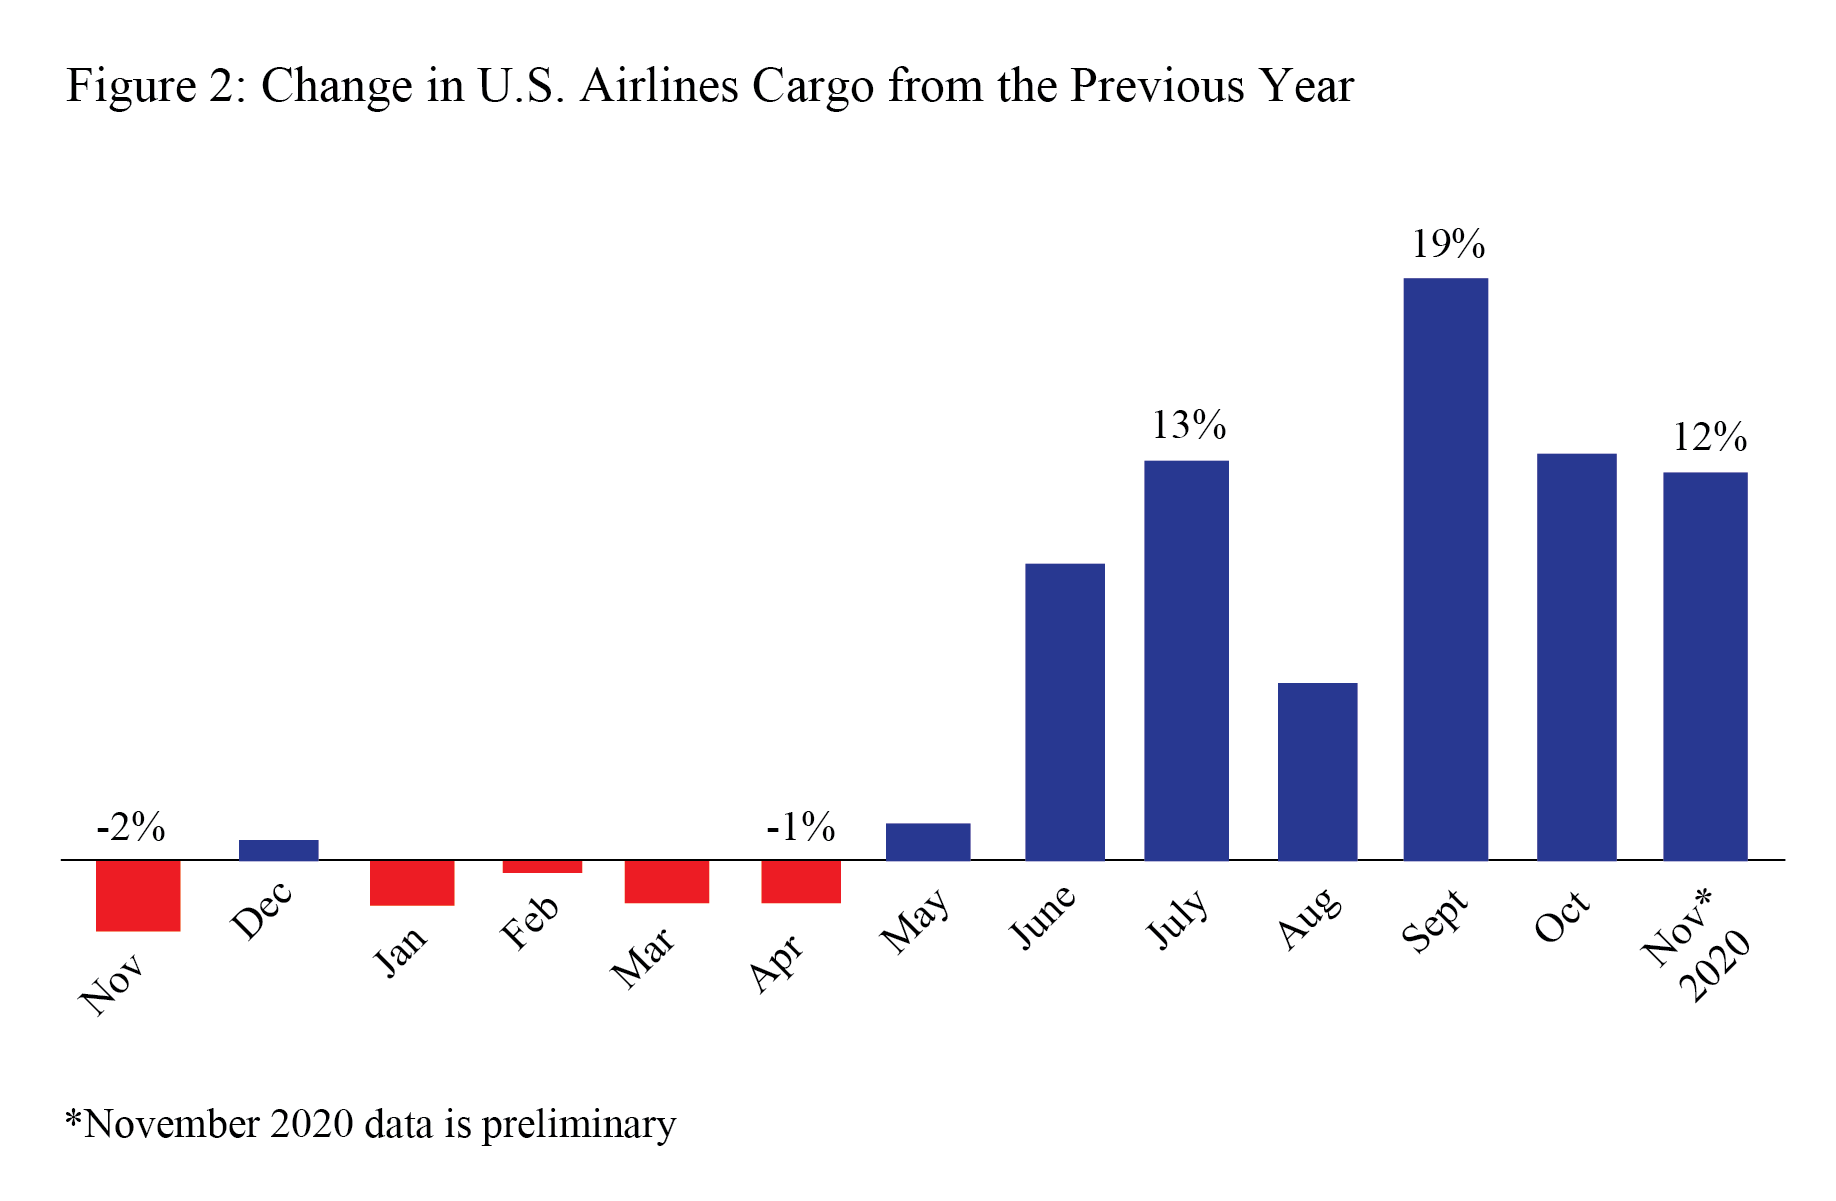
TBD U.S. Airlines Cargo, December 2020 (preliminary)
TBD U.S. Airlines Passengers, December 2020 (preliminary)
TBD Airline On-Time/Tarmac Data, December and Calendar Year 2020
Previously Released
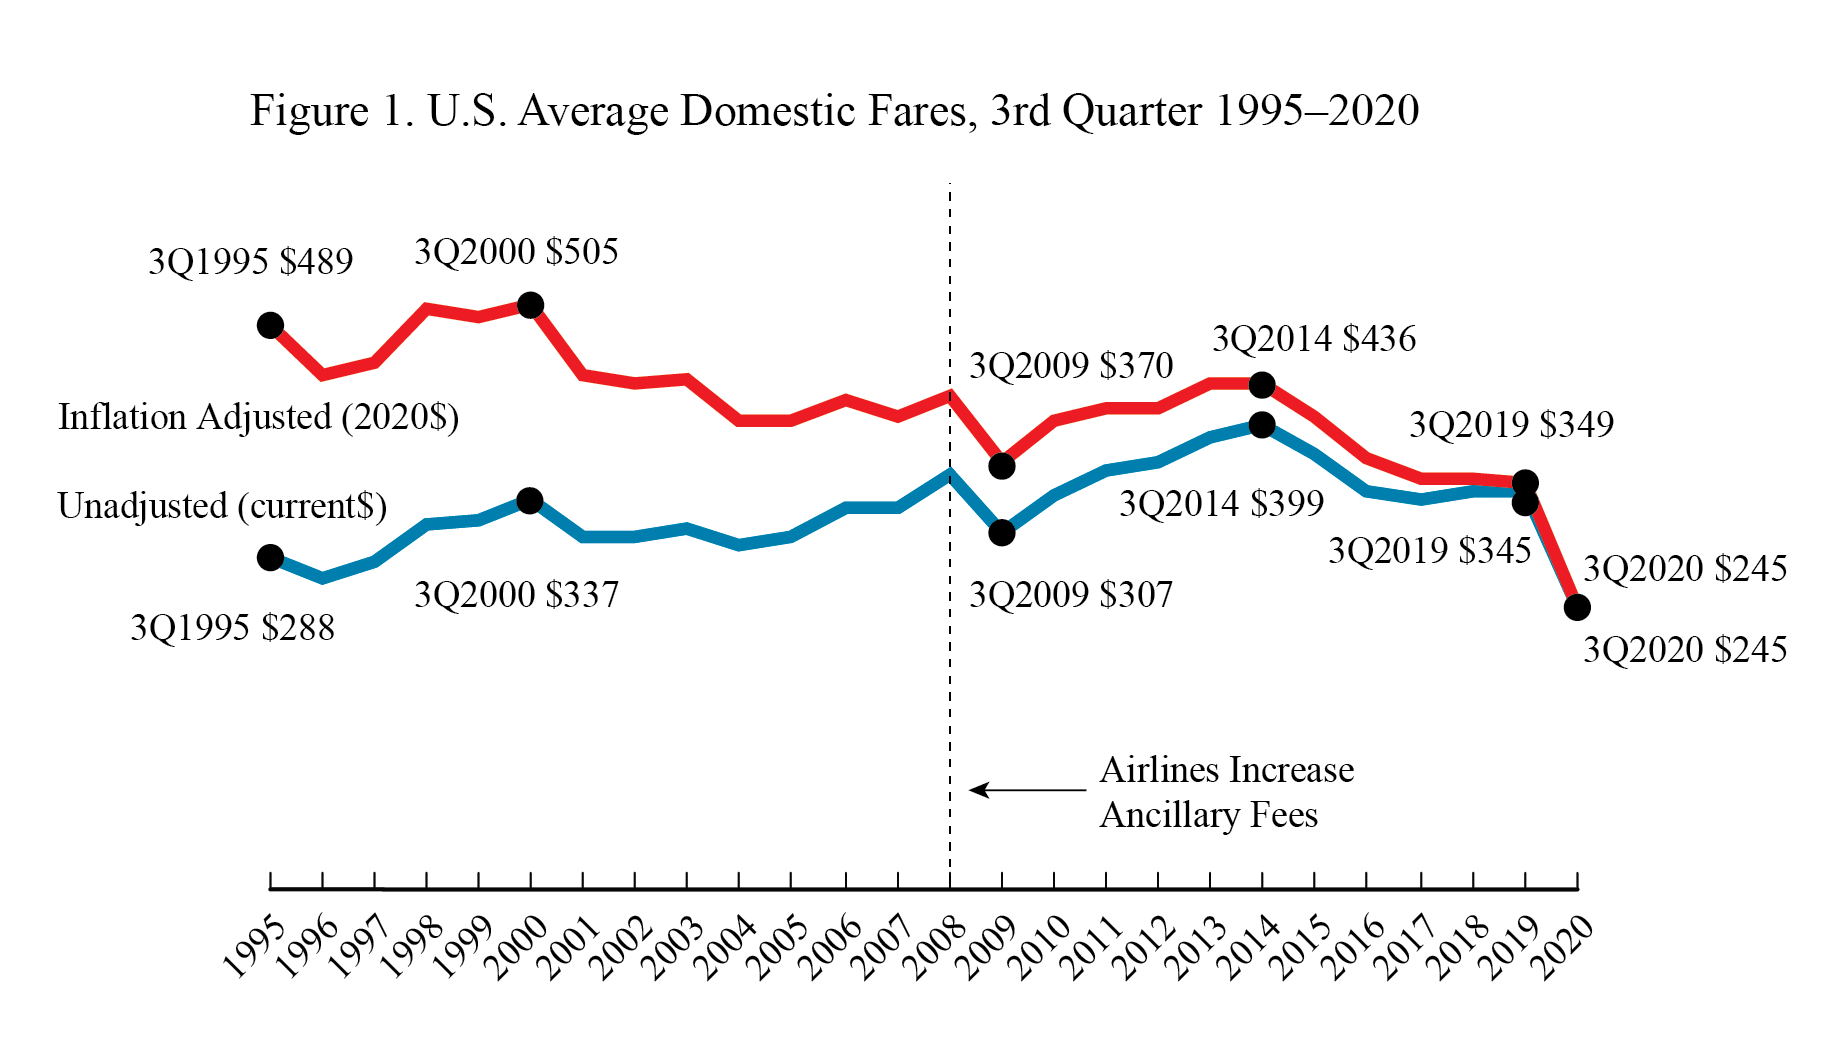
January 19 - Average Air Fares, 3rd Quarter 2020
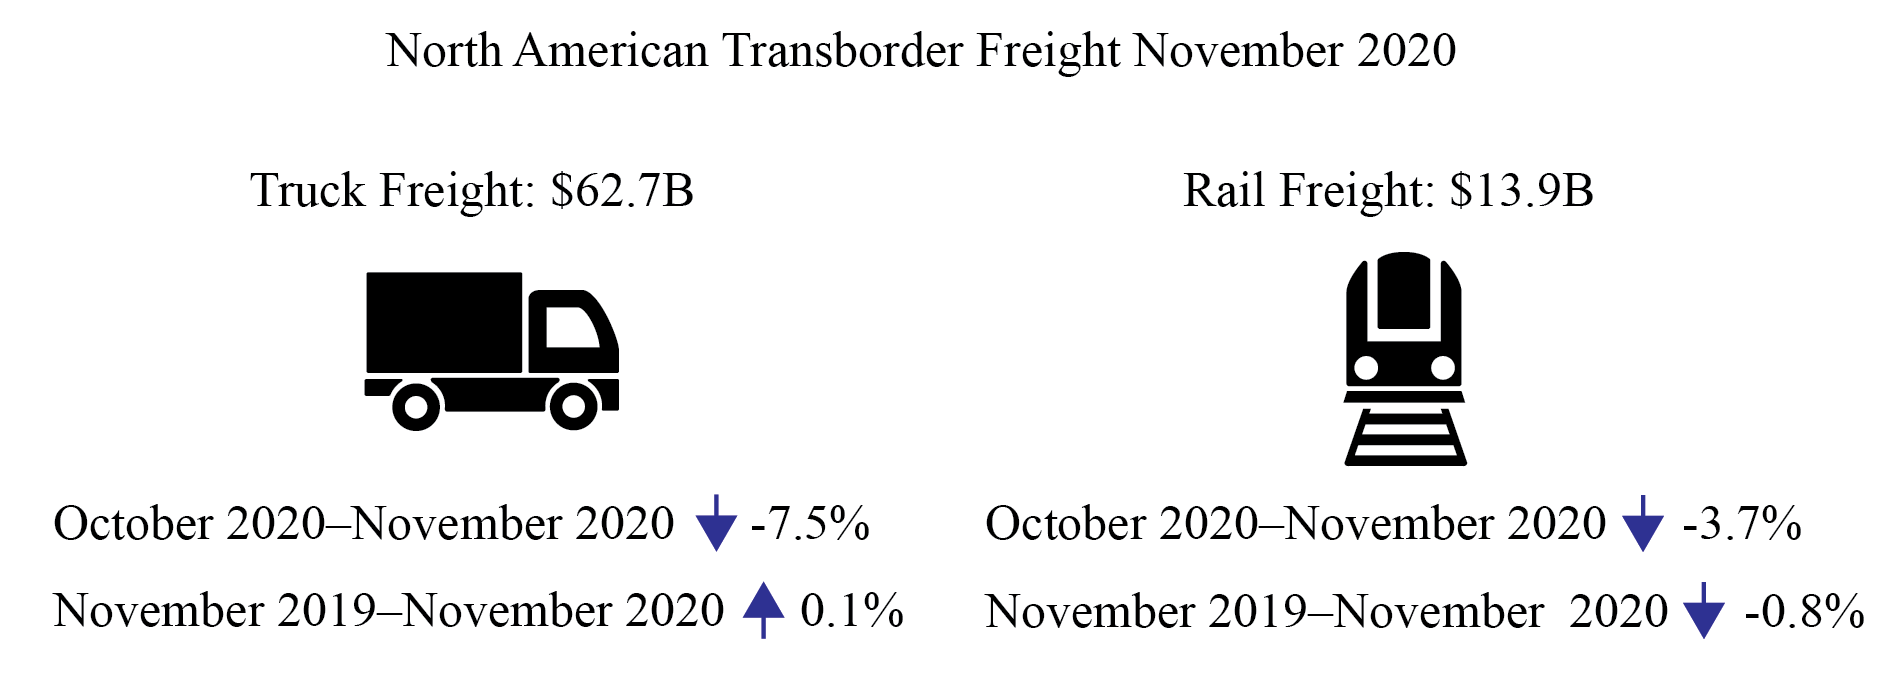
January 28 - North American Freight Data, November 2020
BTS Releases in the Next Two Weeks
Wednesday, February 3, 2021 - 11:00am ET Previous release: U.S. airlines November 2020 fuel consumption was 5% higher than October 2020 and 89% higher than April 2020. April was the lowest monthly fuel usage on record (447M gallons), dating back to 2000. November 2020 fuel consumption was down 42% from November 2019. Fuel consumed by U.S. airlines' scheduled services: November 2019 1.4 billion gallons October 2020 807 million gallons November 2020 845 million gallons
Industry summary of airline fuel consumption, total fuel cost and price paid per gallon are available on the database. Individual airline numbers through September are available on the BTS website. Individual airline numbers for October, November and December will be available on May 3.
Tuesday, February 9, 2021 - 11:00am ET Previous release: U.S. airlines employed 678,287 workers in the middle of November 2020, 28,790 5,000 more than in mid-October 2020 but almost 77,000 fewer than in March 2020. The November numbers consist of 565,281 full-time and 113,006 part-time workers. Total employment (full-time + part-time) by all U.S. airlines including scheduled passenger, charter and cargo: November 2019 751,146 October 2020 673,278 November 2020 678,287 Regulations require airlines to report employment numbers for a pay period near the 15th of the month. Monthly full-time and part-time employment statistics are reported by U.S. airlines that operate at least one aircraft that has more than 60 seats or the capacity to carry a payload of passengers, cargo and fuel weighing more than 18,000 pounds.
Wednesday, February 10, 2021 - 10:00am ET The Freight TSI measures the month-to-month changes in for-hire freight shipments by mode of transportation. In the previous release for November, the Freight TSI fell 0.1% in November from October, falling slightly after two consecutive monthly increases. From November 2019 to November 2020 the index fell 3.8% compared to a decline of 0.9% from November 2018 to November 2019 and a rise of 5.8% from November 2017 to November 2018.
Thursday, February 11, 2021 - 11:00am ET BTS release of reported airline data through November. Data are for U.S. airlines monthly passengers, revenue passenger-miles, available seat-miles and load factor for systemwide, domestic and international. Numbers are seasonally-adjusted and unadjusted. In the previous release, U.S. airlines carried 29.4 million systemwide (domestic and international) scheduled service passengers in October 2020, seasonally adjusted, up 8.4% from September. There were 27.2 million domestic passengers and 2.2 million international passengers on U.S. airlines flights in October.
TBD This release provides preliminary monthly cargo data from the U.S. airlines that carry the most cargo. These airlines carry 95% of the cargo (freight + mail) on U.S. airlines. From the previous month's release, U.S. airlines carried 12% more cargo by weight in November 2020 (preliminary) than in November 2019. The rise was fueled by a gain of 13% in domestic cargo and 10% rise in international cargo.
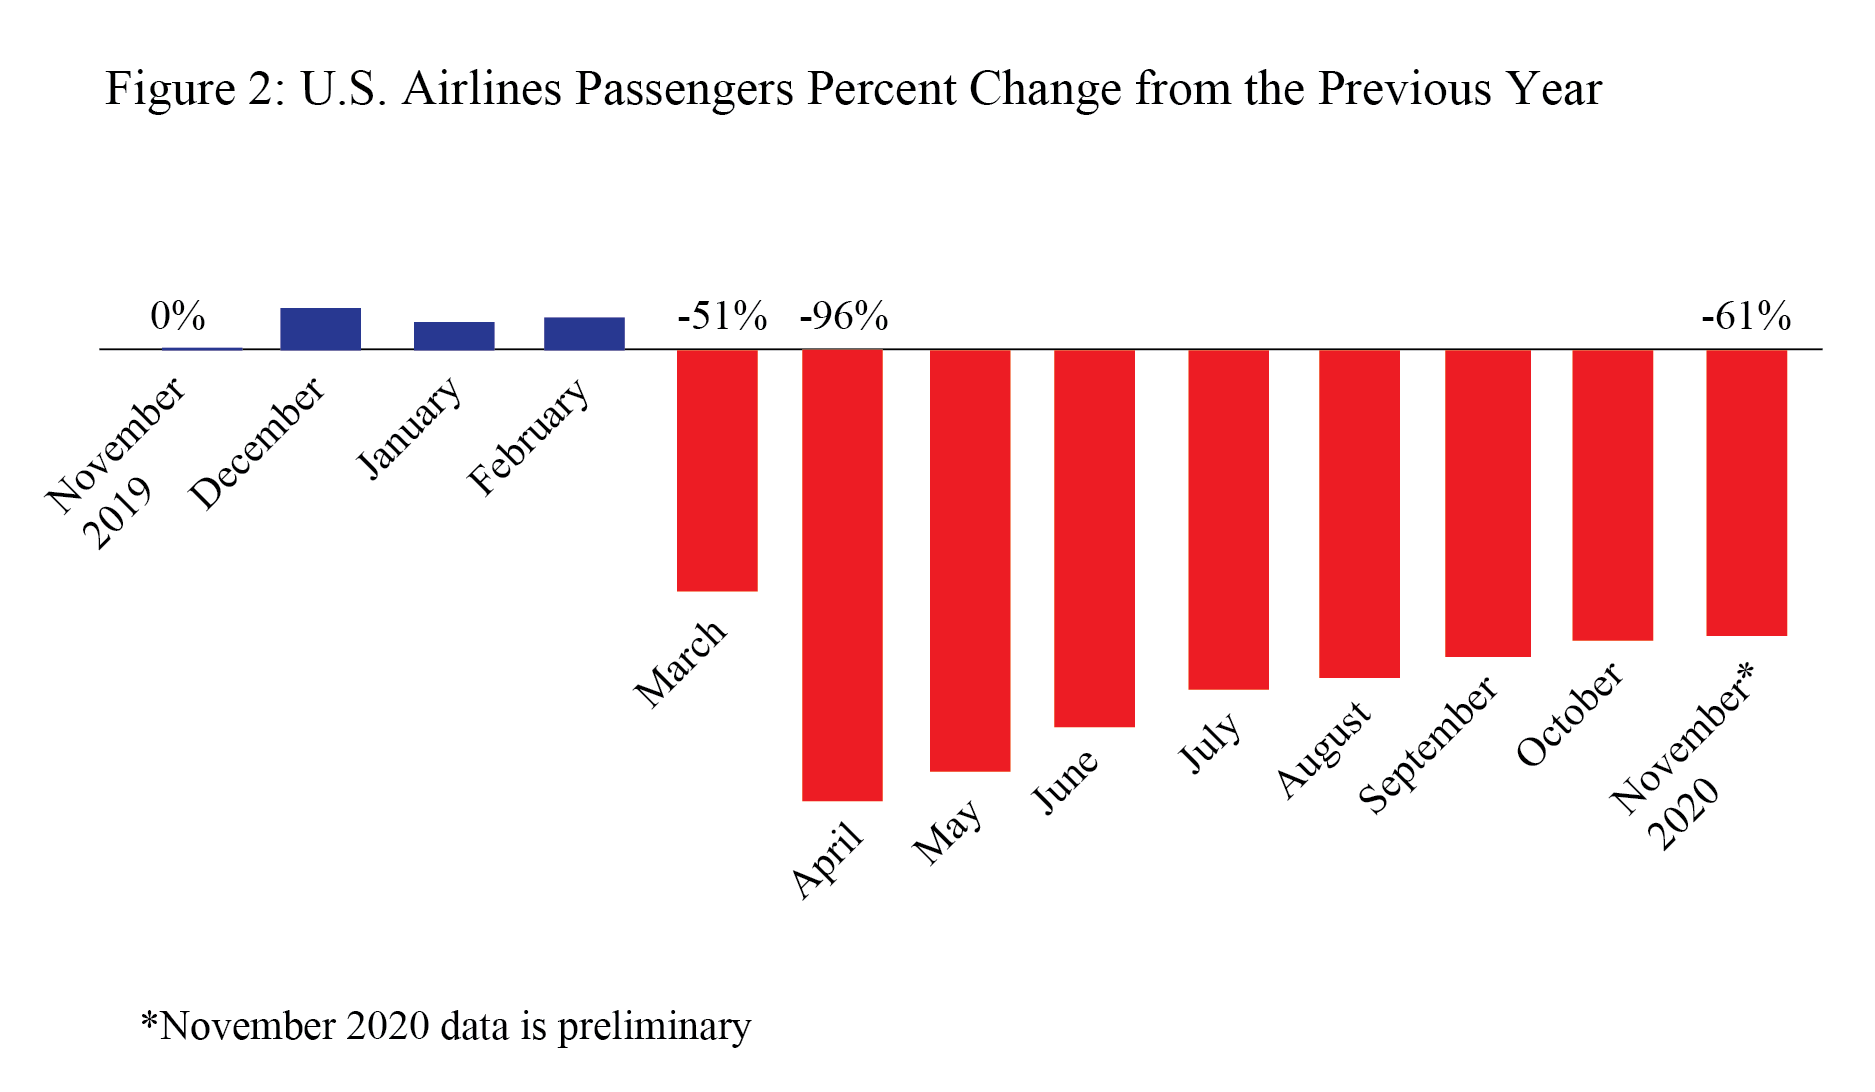
TBD This release provides preliminary monthly passenger data from the U.S. airlines that carry the most passengers. These airlines carry 99% to scheduled service passengers on U.S. airlines. From the previous month's release, U.S. airlines U.S. airlines carried 61% fewer scheduled service passengers in November 2020 than in November 2019. The 61% decline from October 2019 was the smallest year-to-year decrease since March. The large airlines carried 28.5 million passengers in November 2020 (preliminary), compared to 72.8 million passengers in November 2019 and up from 3.0 million in April 2020, which was the lowest monthly total in BTS records dating back to 1974. The previous low was 14.6 million passengers in February 1975.
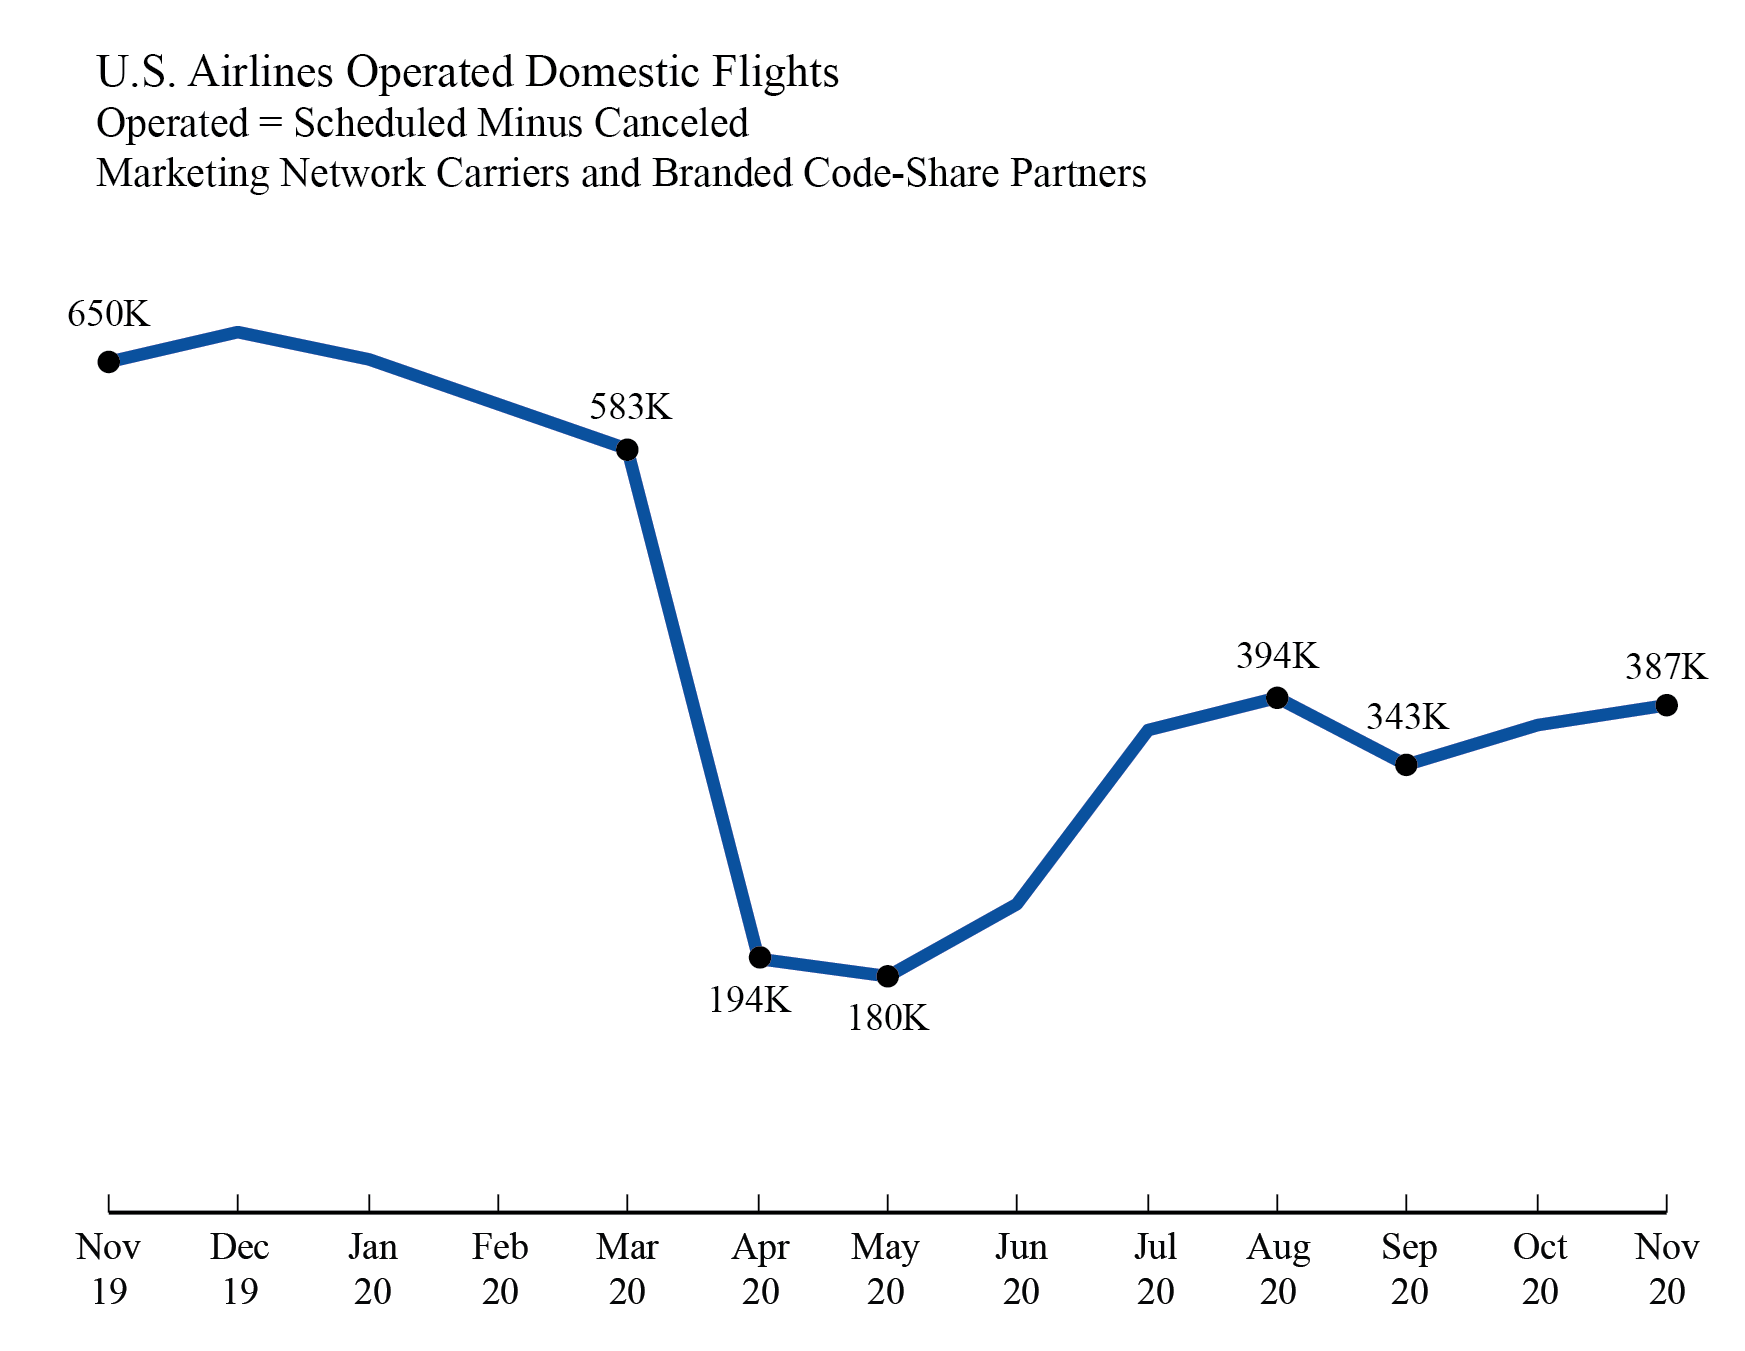
Date TBD This release consists on U.S. airline domestic monthly on-time performance, cancellations, tarmac data, mishandled baggage released in coordination with the Department of Transportation's release of the Air Travel Consumer Report. From the previous month's release, the 10 reporting marketing network carriers 389,587 scheduled domestic flights in November 2020 compared to 374,538 flights in October 2020 and 655,072 flights in November 2019. Of those 389,587 scheduled flights, 0.5%, 2,106 flights, were canceled. As a result of schedule reductions and cancellations, the carriers reported operating 387,481 flights in November 2020, compared to 372,544 flights in October 2020 and the all-time monthly low of 180,151 flights in May 2020. Airlines operated 649,511 flights in November 2019. The marketing carriers include branded code-share partners of mainline carriers.
BTS Previously
BTS has released the following:
Released January 19 U.S. domestic average air fares declined in the third quarter of 2020 to $245, the lowest inflation-adjusted average quarterly air fare in Bureau of Transportation Statistics (BTS) records dating back to 1995. The previous low was $262 in the second quarter of 2020. Air fares declined along with passenger demand. Airlines reported 27 million originating passengers in the third quarter of 2020, down from 86 million passengers a year earlier.
Released Jan. 28 Freight between the U.S. and other North American countries (Canada and Mexico) in November 2020:
BTS Contact: Dave Smallen 202-366-5568
| ||||||||||||||||||


Face of Defense: Mayor Deploys During COVID-19 Crisis
|  | |||||||||


 |
| OUR STORY KNOW YOUR MILITARY ASK US LATEST STORIES |
| This email was sent to sajanram.shrestha@blogger.com using GovDelivery Communications Cloud on behalf of: U.S. Department of Defense 1400 Defense Pentagon Washington, DC 20301-1400 |
Subscribe to:
Posts (Atom)