| BTS 2-Week Outlook Bureau of Transportation Statistics Upcoming Releases March 2-13 Upcoming from March 2 Wednesday, March 4, 2020 - 11:00am ET Airline Fuel Cost and Consumption, January 2020 Monday, March 9, 2020 - 11:00am ET North American Freight Data, Annual 2019 Thursday, March 10, 2020 - 11:00am ET Airline Full-Time/Part-Time Employment, January 2020 Wednesday, March 11, 2020 - 10:00am ET Transportation Services Index, January 2020 Thursday, March 12, 2020 - 11:00am ET Airline Traffic Data, February 2020 Estimated, December 2019 Reported Previously Released February 19 - Airline On-Time/Tarmac Times, December 2019 February 19 - Passenger Airline Employment, December 2019 February 25 - North American Freight Data, December 2019 The Bureau of Transportation Statistics will release the following data sets in the next two weeks: - Airline Fuel Cost and Consumption, January 2020
Wednesday, March 4, 2020 - 11:00am ET Previous release: U.S. airlines December fuel cost was $2.00/gal, up 1 cent from November 2019 ($1.99) and down 6 cents from December 2018 ($2.06). Industry summary of airline fuel consumption, total fuel cost and price paid per gallon are available on the database. Individual airline numbers through September are available on the BTS website. - North American Freight Data, Annual 2019
Monday, March 9, 2020 - 11:00am ET This release provides an annual summary of North American Transborder freight by mode. In the previous release, BTS reported that trucks were the most heavily utilized mode in 2018 for moving goods to and from both Canada and Mexico, carrying 63% of the freight transported. Trucks accounted for $772 billion of the $1.2 trillion in freight flows with Canada and Mexico in 2018. Rail accounted for $179 billion, almost 15%. 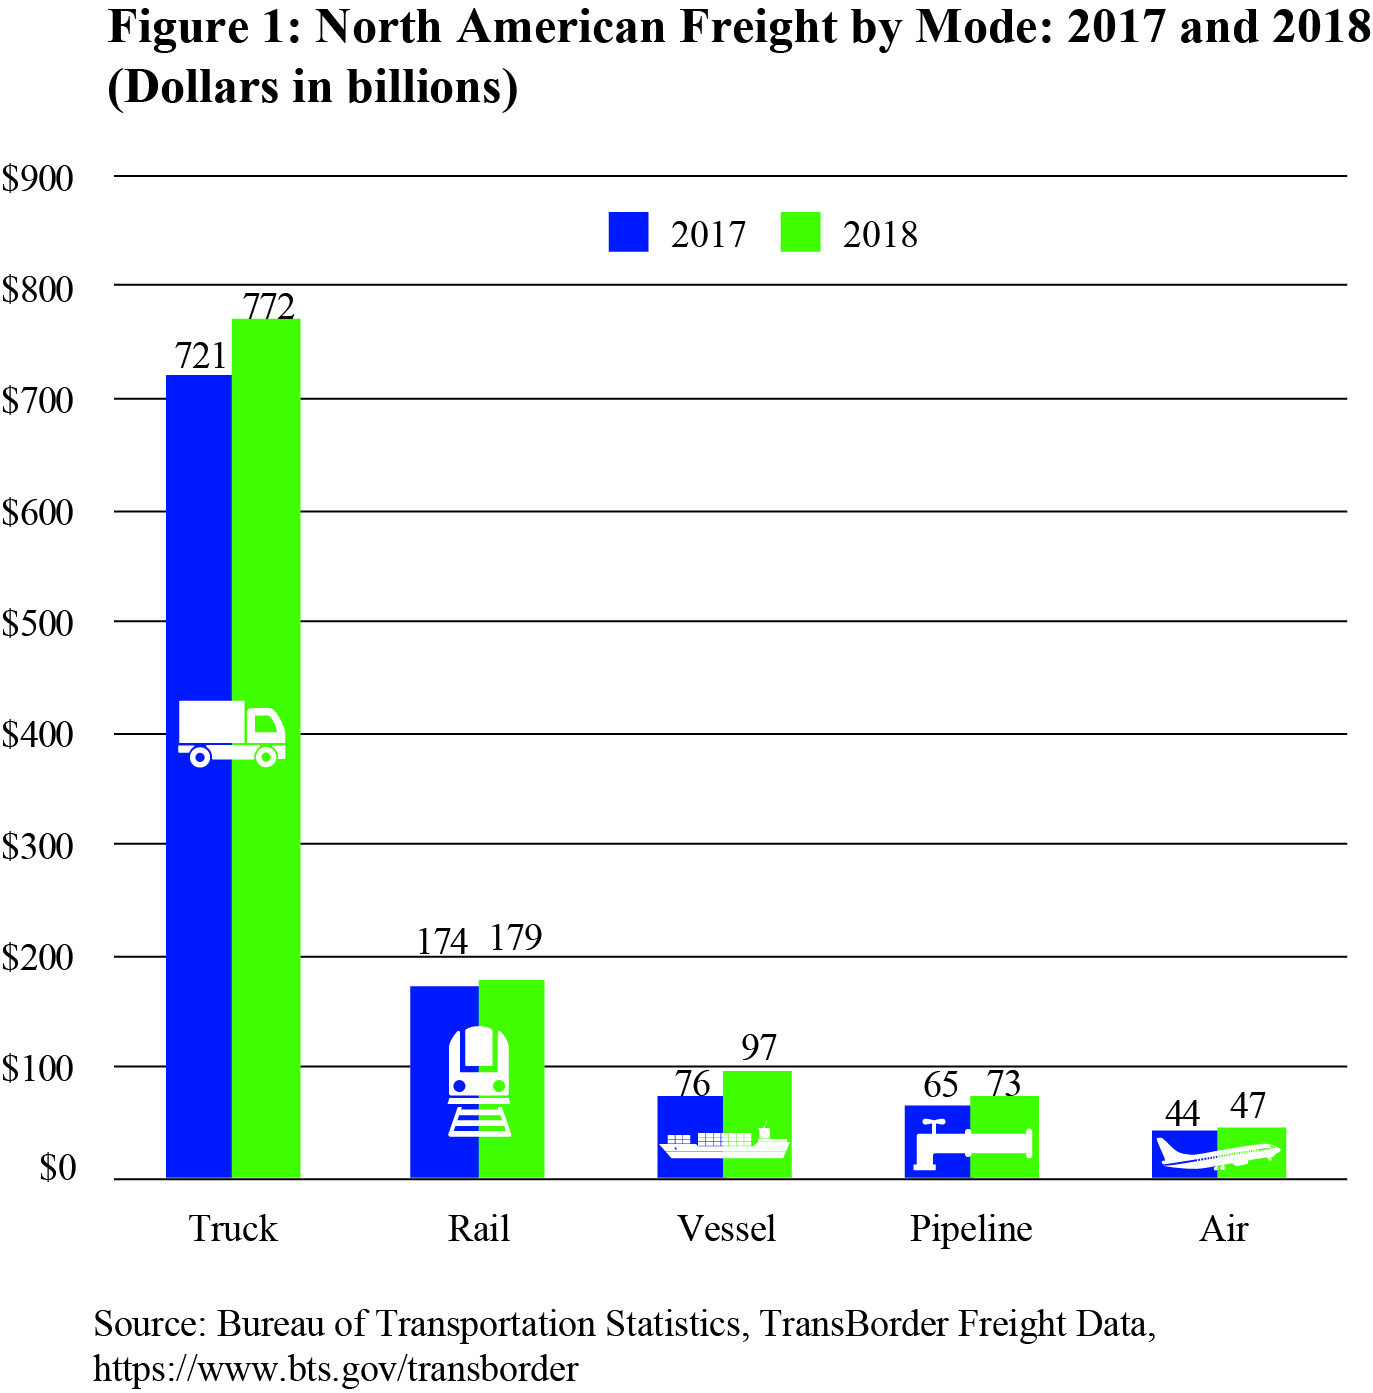
- Airline Full-Time/Part-Time Employment, January 2020
Thursday, March 10, 2020 - 11:00am ET Previous release: U.S. airline industry December employment (749,965 total full-time and part-time) was up 0.2% from November 2019 and up 2.8% from December 2018 (passenger+cargo). Monthly full-time and part-time employment statistics are reported by U.S. airlines that operate at least one aircraft that has more than 60 seats or the capacity to carry a payload of passengers, cargo and fuel weighing more than 18,000 pounds. - Freight Transportation Services Index (TSI), January 2020
Wednesday, March 11, 2020 - 10:00am ET The Freight TSI measures the month-to-month changes in for-hire freight shipments by mode of transportation. The Passenger TSI measures the month-to-month changes in travel that involves the services of the for-hire passenger transportation sector. In the previous release for December, the Freight TSI fell 0.9% from revised November, declining to lowest level since August 2018. The December year-end index was down 0.8% in one year, up 2% in two years, up almost 9% in three years 
- Airline Traffic Data, February 2020 estimate, December 2019 reported
Thursday, March 12, 2020 - 11:00am ET BTS estimates of air traffic data for January and Februarybased on reported data through December. Estimates are for U.S. airlines monthly passengers, revenue passenger-miles, available seat-miles and load factor for systemwide, domestic and international. Numbers are seasonally-adjusted and unadjusted. In the previous release, U.S. airlines carried an estimated 78.6 million systemwide (domestic and international) scheduled service passengers in January 2020, reaching a new seasonally-adjusted all-time high, according to the BTS first estimate, up 0.1% from the December second estimate. BTS estimated 68.9 million domestic passengers and 9.7 million international passengers on U.S. airlines flights in January. The domestic passenger numbers were a seasonally-adjusted all-time high. 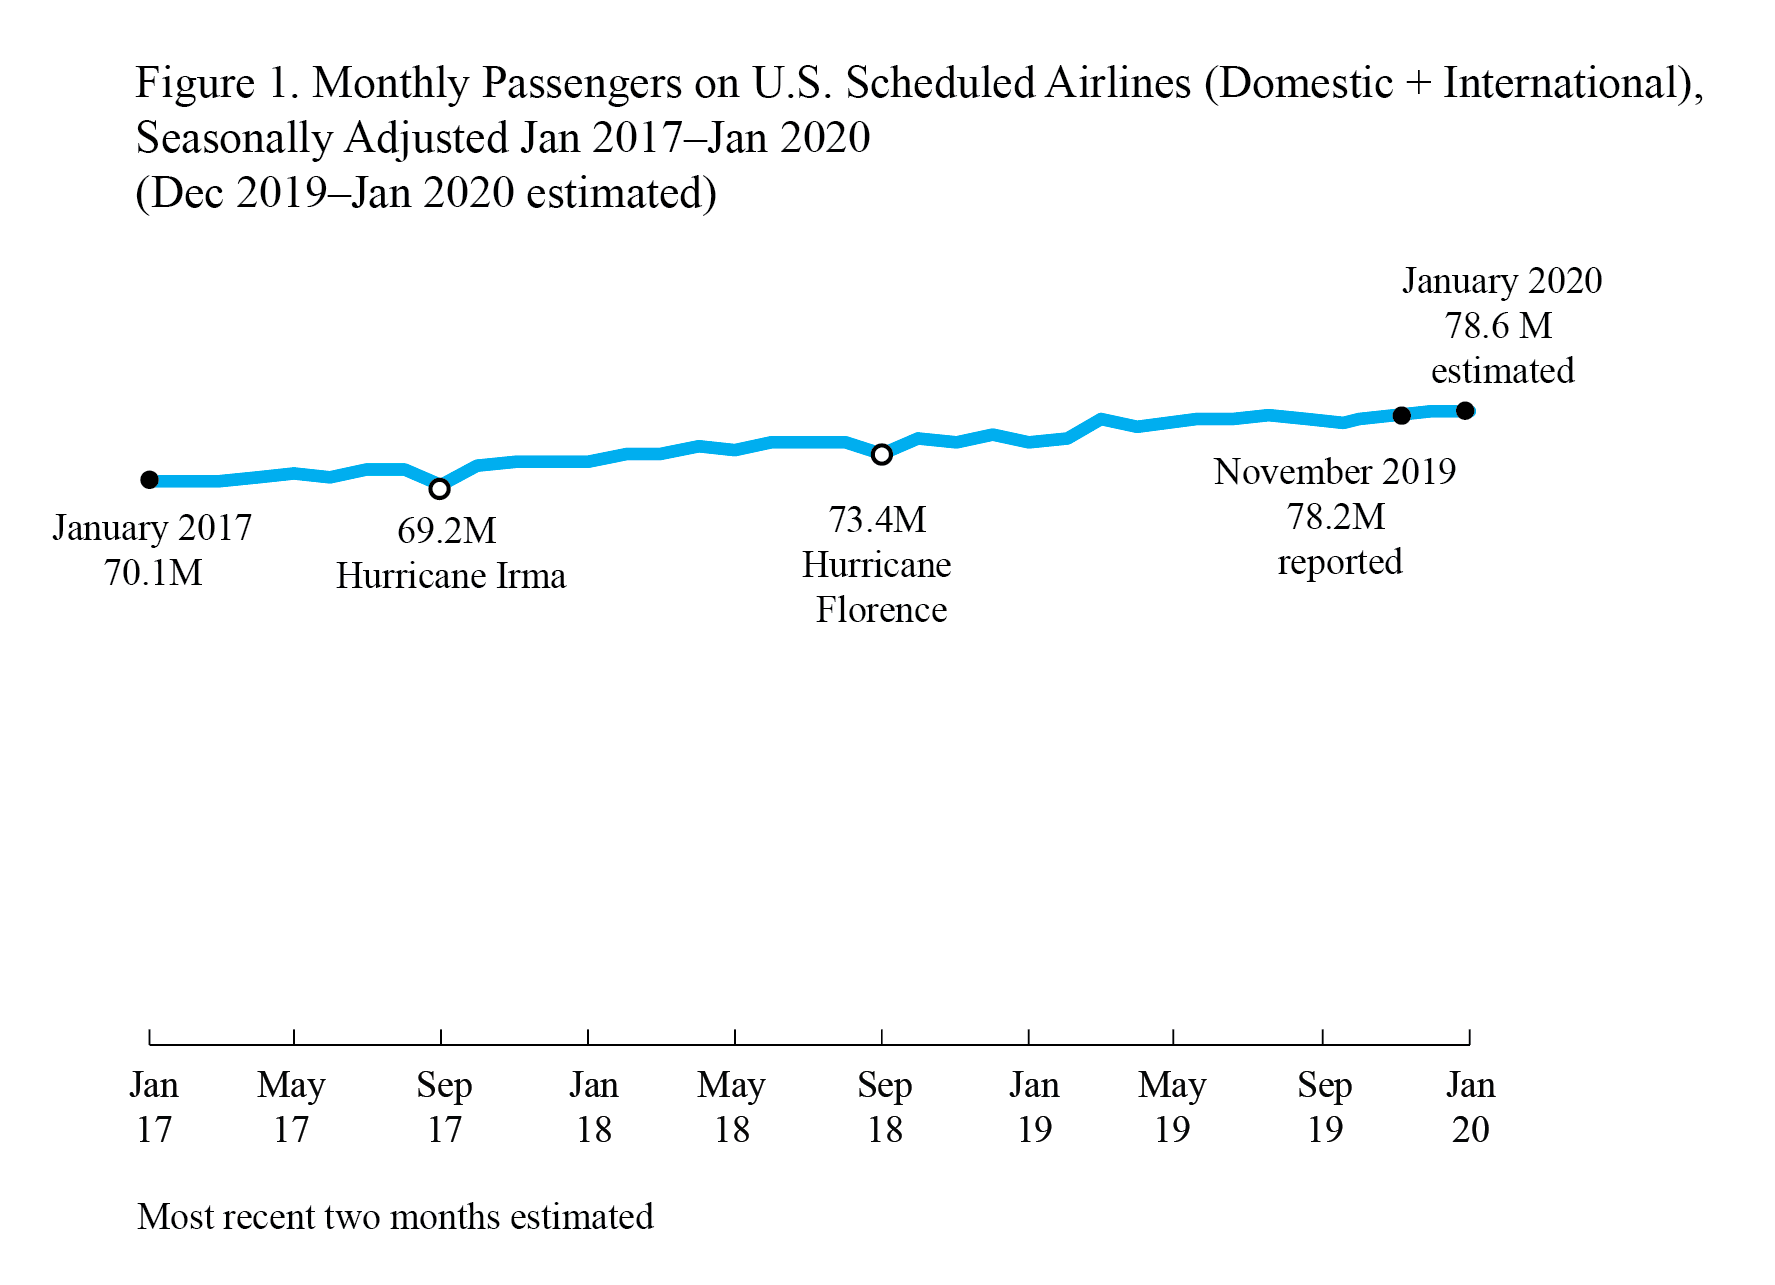
BTS Previously BTS has released the following: - Air Travel Consumer Report: December 2019, Full Year 2019 Numbers
Released February 19 For the full year 2019, marketing carriers posted an on-time arrival rate of 79.0%, a slightly lower rate than 79.2% in 2018. For the full year 2019, marketing carriers canceled 1.9% of their scheduled domestic flights, compared to a rate of 1.7% in 2018. 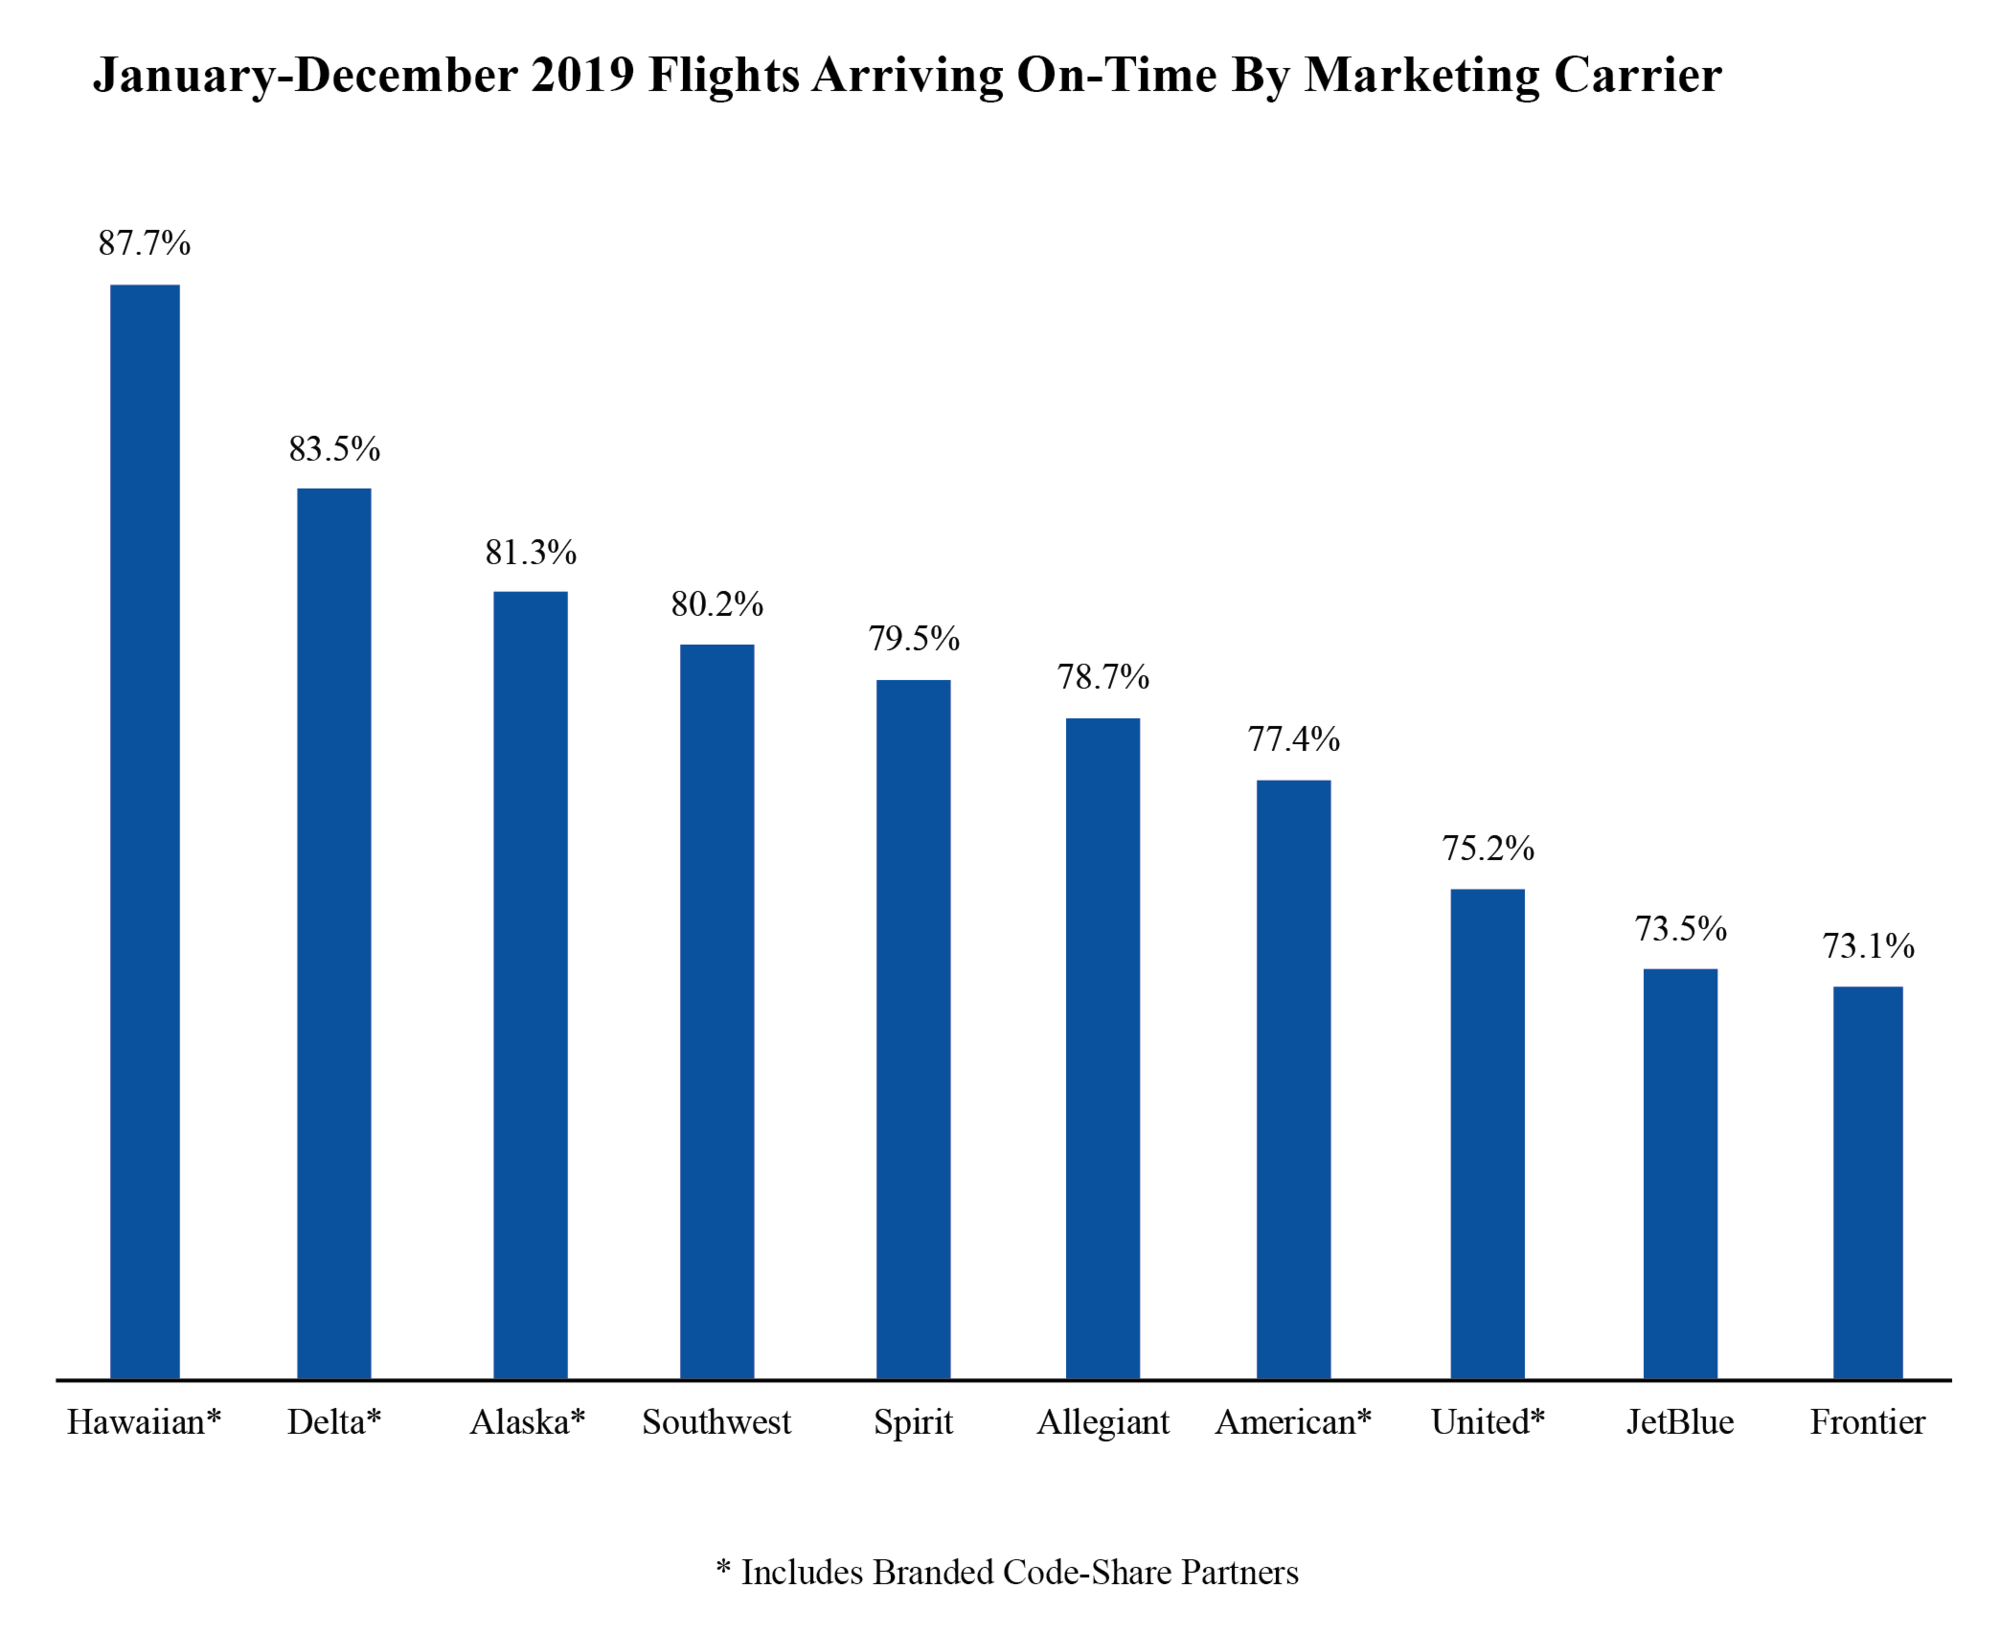
- Passenger Airline Employment, December 2019
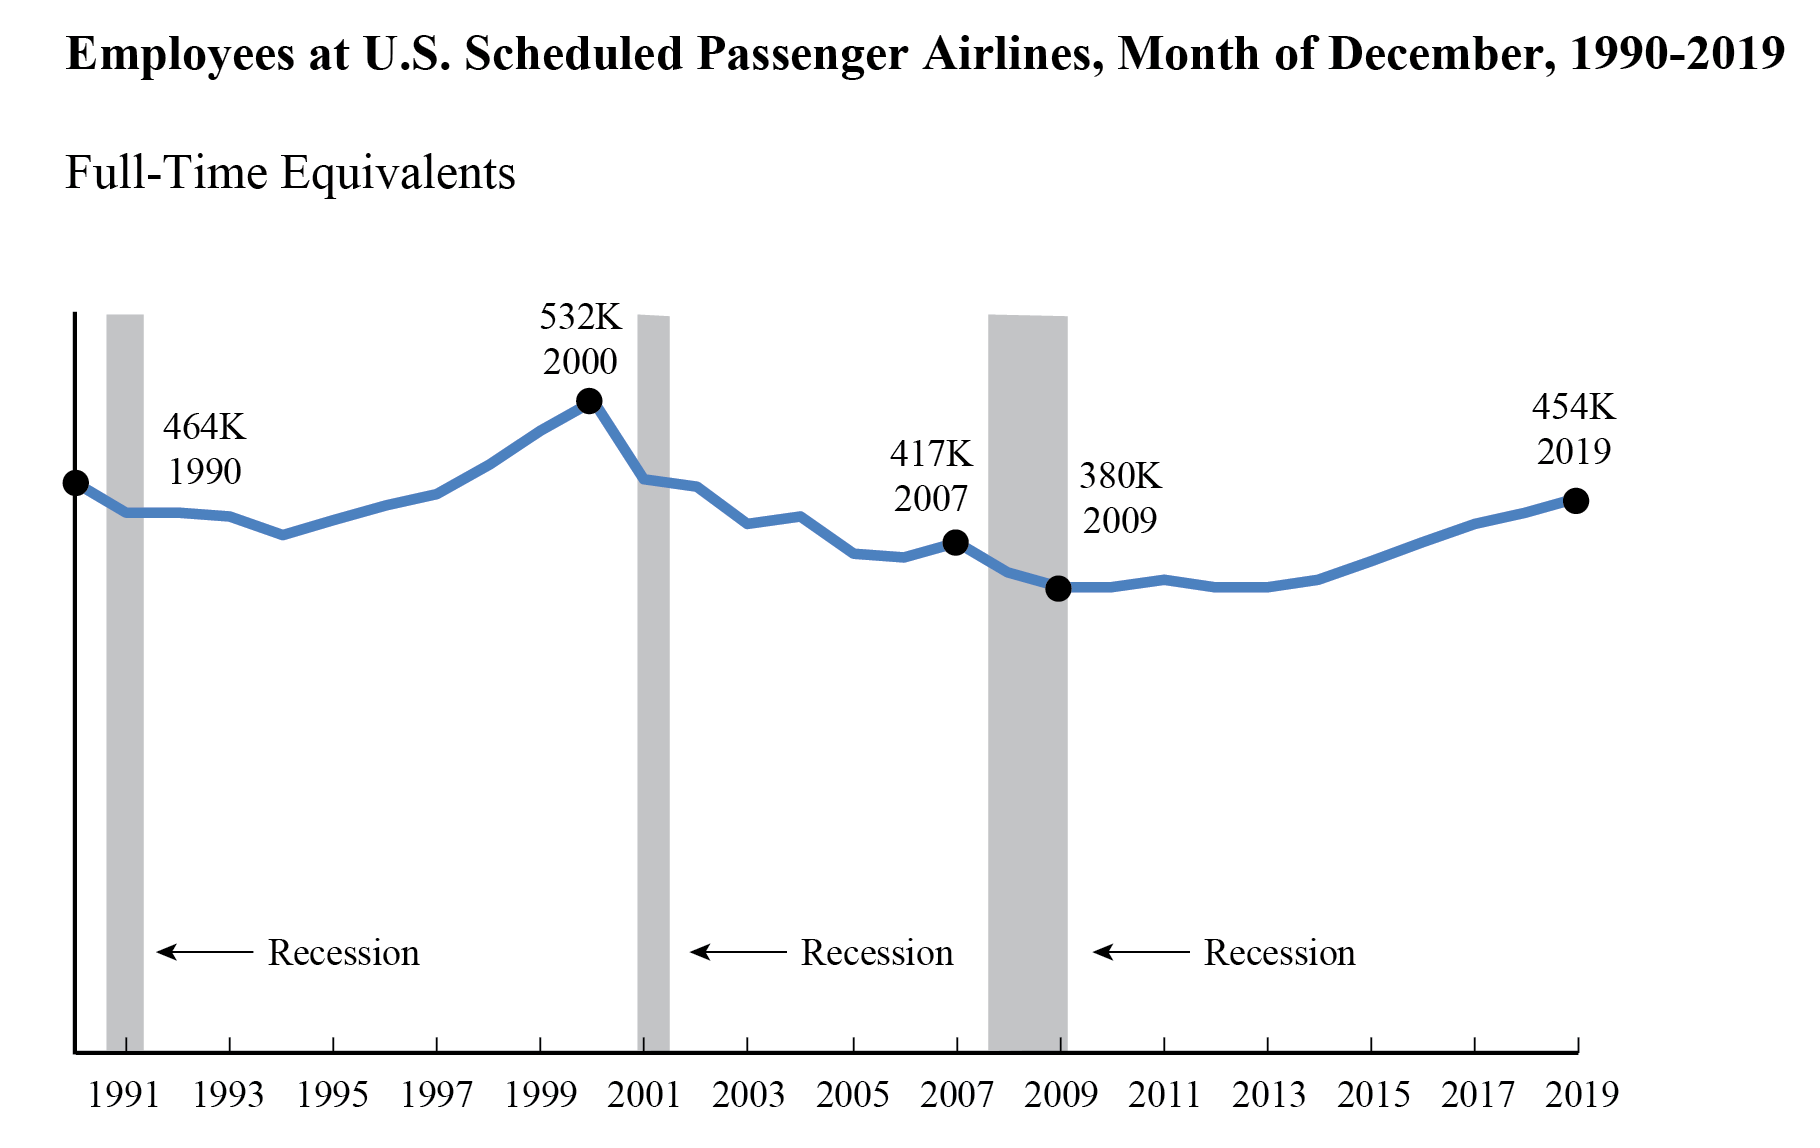
Released February 19 BTS reported that U.S. scheduled passenger airlines employed 3.1% more workers in December 2019 than in December 2018. - December's 453,976 full-time equivalent employees (FTEs) was the highest monthly FTE total since March 2003 (458,598 FTEs).
- December was the 74th consecutive month that U.S. scheduled passenger airline FTEs exceeded the same month of the previous year.
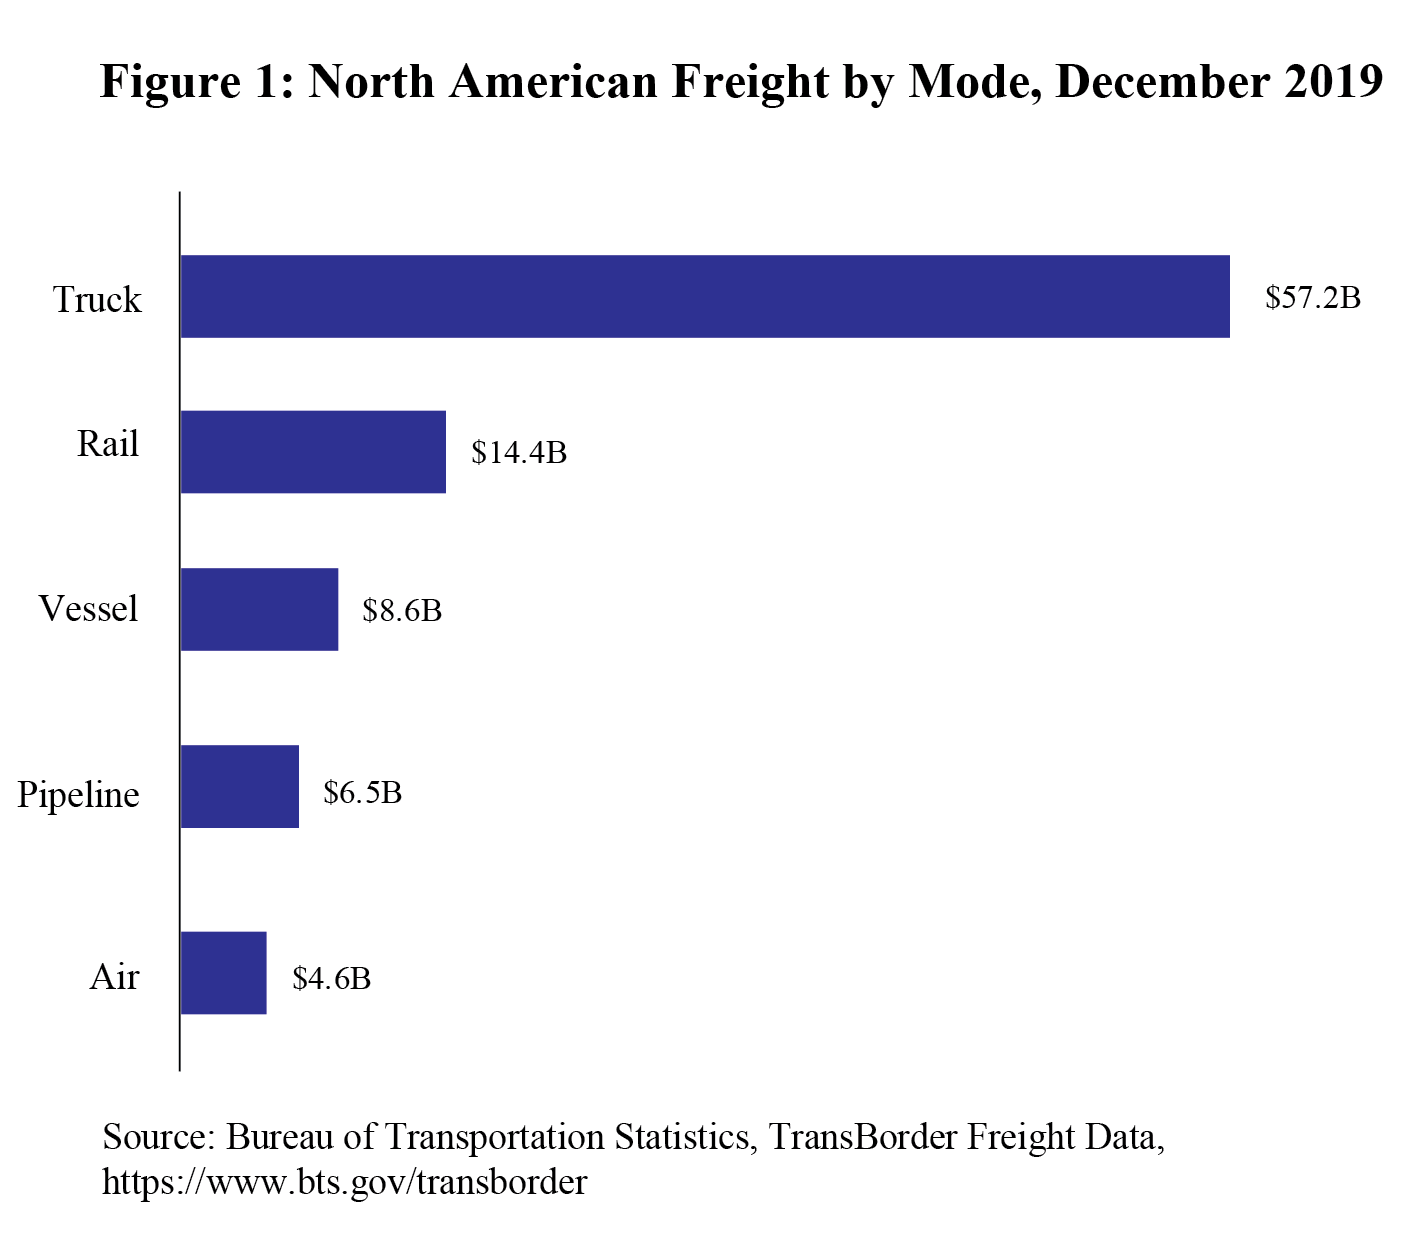
- North American Freight Data, December 2019
Released February 25 BTS reported that truck was the most used mode for shipping freight between the U.S. and other North American countries (Canada and Mexico) in December 2019: - Total Transborder Freight: $3 billion of transborder freight moved by all modes of transportation, up 4.0% compared to December 2018
- Most-used mode: Truck moved $2 billion of freight, down 0.3% compared to December 2018
- Second most-used mode: Rail moved $4 billion of freight, up 1.9% compared to December 2018
See BTS Release Schedule BTS Contact: Dave Smallen 202-366-5568
| U.S. Department of Transportation | 1200 New Jersey Avenue, SE | Washington DC 20590 | 202-385-HELP (4357) |  | |